
Examples: Cartoons
Cartoon images are used within some Compare and Contrast Tables and some Concept Flow Diagrams and also as standalone images. They are used to enhance "rememberability".
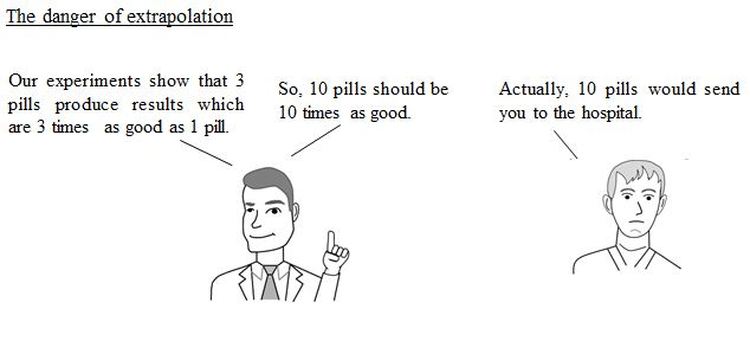
For example, if you write words saying that a Regression model is not valid outside the range of data used to create it (i.e. don't extrapolate), the reader might remember that warning – or not. I personally wrote that warning in a draft of this book. Then, a couple of months later, when I was doing something else, I forgot it – briefly. When I began thinking about extrapolating the Regression model I was working on, the following cartoon popped up in my mind. I had remembered the cartoon before I remembered the principle behind it.
For example, if you write words saying that a Regression model is not valid outside the range of data used to create it (i.e. don't extrapolate), the reader might remember that warning – or not. I personally wrote that warning in a draft of this book. Then, a couple of months later, when I was doing something else, I forgot it – briefly. When I began thinking about extrapolating the Regression model I was working on, the following cartoon popped up in my mind. I had remembered the cartoon before I remembered the principle behind it.
Reproduced by permission of John Wiley & Sons, Inc.
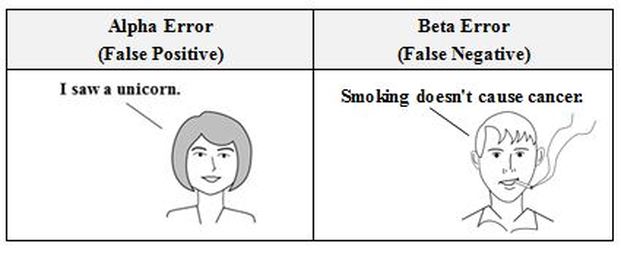
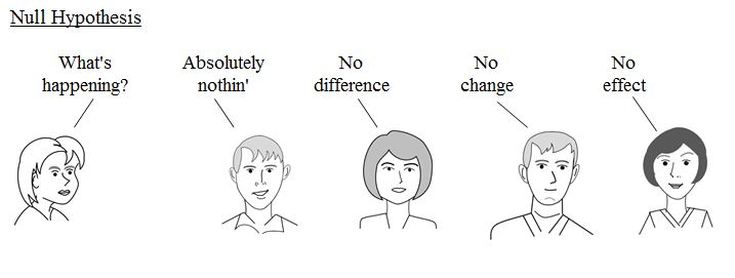
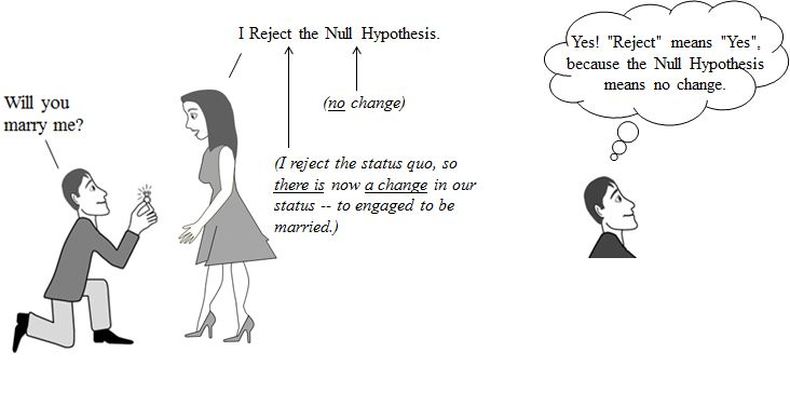
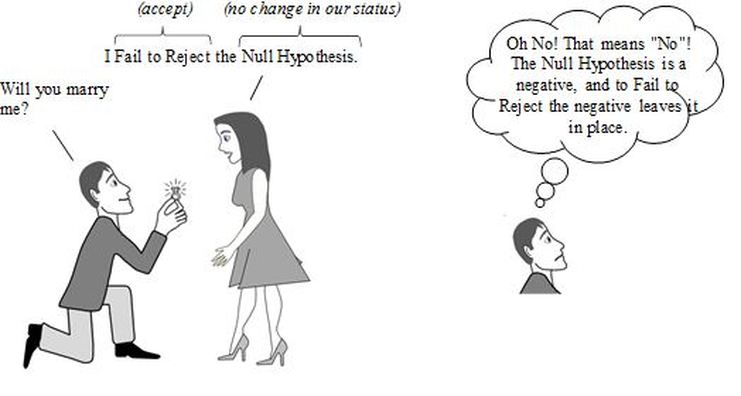
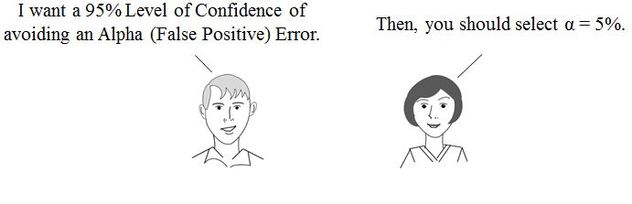
Here are a few more.
Reproduced by permission of John Wiley & Sons, Inc.
Reproduced by permission of John Wiley & Sons, Inc.
Reproduced by permission of John Wiley & Sons, Inc.
Reproduced by permission of John Wiley & Sons, Inc.
Reproduced by permission of John Wiley & Sons, Inc.