STATISTICS FROM A TO Z<br />-- CONFUSING CONCEPTS CLARIFIED
  • Home
    • Why This Book Is Needed
    • Articles List, Additional Concepts
    • Examples: 1-Page Summaries
    • Examples: Concept Flow Diagram
    • Examples: Compare and Contrast Tables
    • Examples: Cartoons
    • Example: Which to Use When Article
  • Buy
  • Blog
  • Sample Articles
  • Videos
  • Author
  • Communicate
  • Files
  • Errata

Statistics Tip of the Week : the Binomial Shapeshifter

2/27/2019

0 Comments

 
The Binomial Distribution is used with Count data. It displays the Probabilities of Count data from Binomial Experiments. In a Binomial Experiment,
  • There are a fixed number of trials (e.g. coin flips)
  • Each trial can have only 1 of 2 outcomes.
  • The Probability of a given outcome is the same for each trial.
  • Each trial is Independent of the others

There are many Binomial Distributions. Each one is defined by a pair of  values for two Parameters, n and p. n is the number of trials, and p is the Probability of each trial.

The graphs below show the effect of varying n, while keeping the Probability the same at 50%. The Distribution retains its shape as n varies. But obviously, the Mean gets larger. 

Picture
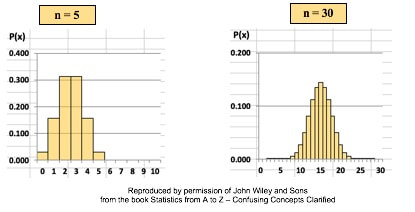
​The effect of varying the Probability, p, is more dramatic.
Picture
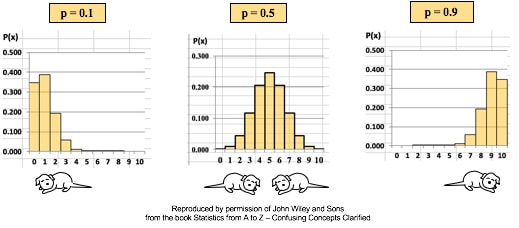
For small values of p, the bulk of the Distribution is heavier on the left. However, as described in my post of July 25, 2018, statistics describes this as being skewed to the right, that is, having a positive skew. (The skew is in the direction of the long tail.) For large values of p, the skew is to the left, because the bulk of the Distribution is on the right. 
0 Comments

New Video: Simple Nonlinear Regression

2/17/2019

0 Comments

 
New video: Simple Nonlinear Regression.
Picture
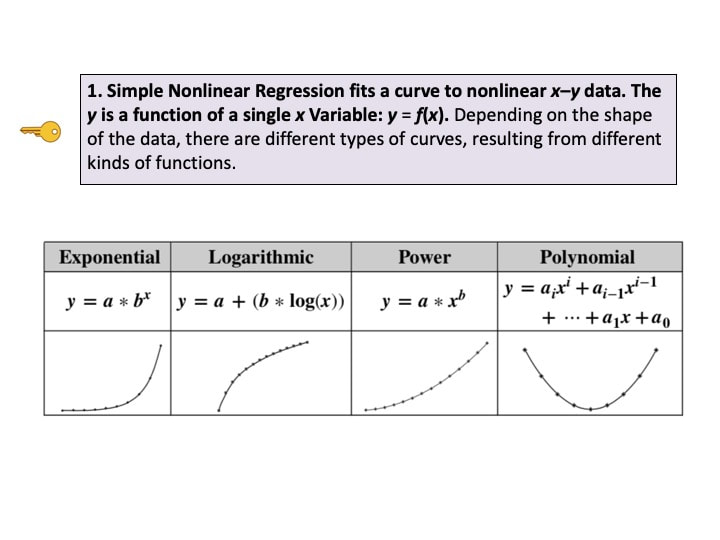
This is the 7th in a playlist on Regression. For a complete list of my available and planned videos, please see the Videos page on this website.
0 Comments

You are not alone if you are confused by Statistics -- #22.

2/13/2019

0 Comments

 
Picture
0 Comments

    Author

    Andrew A. (Andy) Jawlik is the author of the book, Statistics from A to Z -- Confusing Concepts Clarified, published by Wiley.

    Archives

    March 2021
    December 2020
    November 2020
    October 2020
    September 2020
    August 2020
    May 2020
    March 2020
    February 2020
    January 2020
    December 2019
    November 2019
    October 2019
    September 2019
    July 2019
    June 2019
    May 2019
    April 2019
    March 2019
    February 2019
    January 2019
    December 2018
    November 2018
    October 2018
    September 2018
    August 2018
    July 2018
    June 2018
    May 2018
    April 2018
    March 2018
    February 2018
    January 2018
    December 2017
    November 2017
    October 2017
    September 2017
    August 2017
    July 2017
    June 2017
    May 2017
    April 2017
    March 2017
    February 2017
    January 2017
    December 2016
    November 2016
    October 2016
    September 2016
    August 2016

    Categories

    All
    New Video
    Stats Tip Of The Week
    You Are Not Alone

    RSS Feed

  • Home
    • Why This Book Is Needed
    • Articles List, Additional Concepts
    • Examples: 1-Page Summaries
    • Examples: Concept Flow Diagram
    • Examples: Compare and Contrast Tables
    • Examples: Cartoons
    • Example: Which to Use When Article
  • Buy
  • Blog
  • Sample Articles
  • Videos
  • Author
  • Communicate
  • Files
  • Errata