|
This is the 5th of 5 Videos in the playlist "Central Concepts in Inferential Statistics". It visually explains how these 4 concepts at the heart of Inferential Statistics interrelate and work together. This is something that is sorely lacking in other books, websites, and videos that I have seen. There, individual concepts are too often explained in isolation, without showing them in the context of how they work with other concepts. Two different types of graphics are provided in the article in my book and in this video. In each case, they are deconstructed into sections and explained as they are built up. Link to Video Link to Channel Here is how the story is pictured with a Concept Flow Diagram: 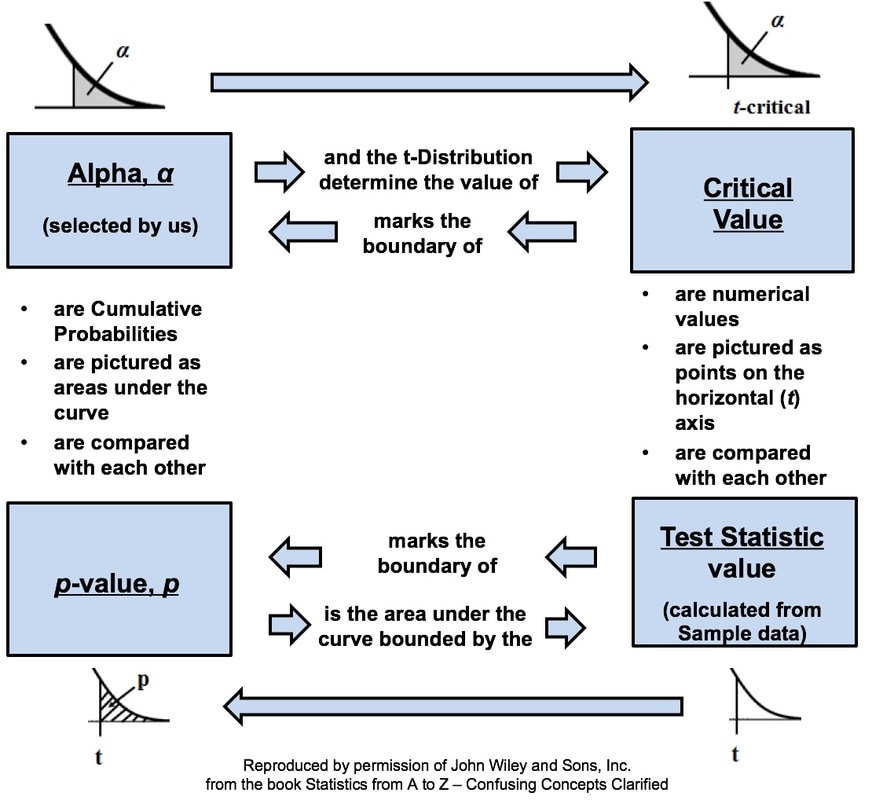 And, here is how it is shown as a Compare and Contrast Table: 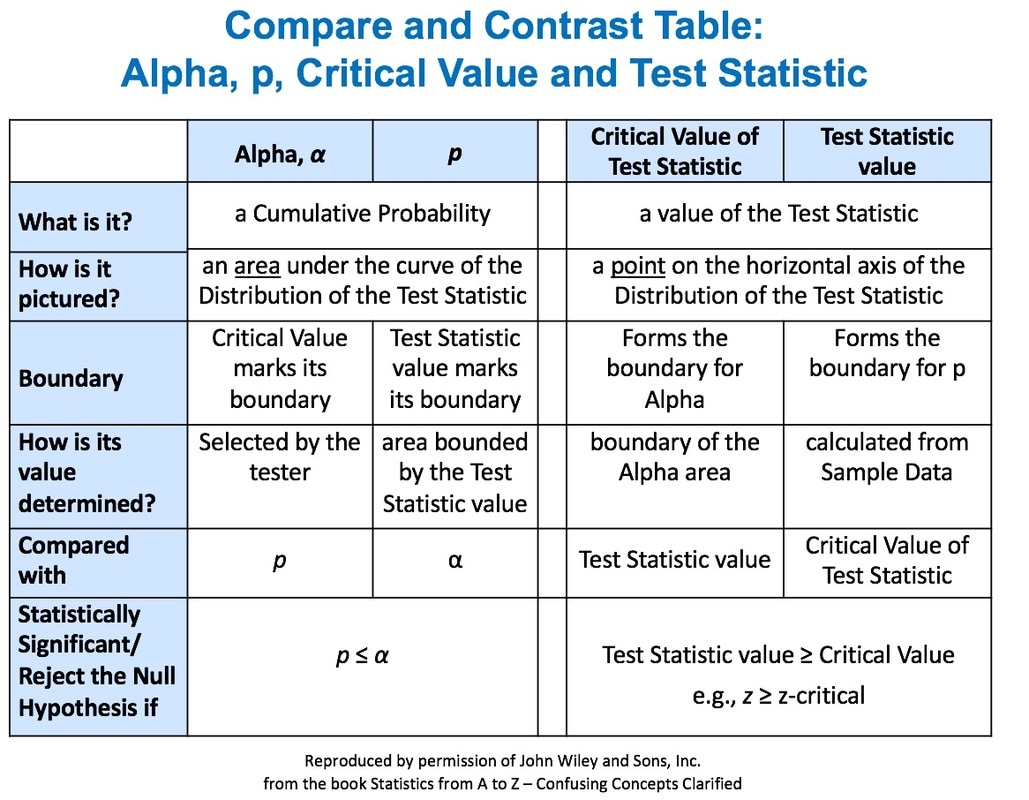
0 Comments
The purpose of Regression analysis is to develop a cause and effect "Model" in the form of an equation. To keep things simple, let's talk about Simple Linear Regression, in which the equation is y = bx + a. The Regression analysis comes up with the values for b and a. Residuals represent the Error in the Regression Model. They represent the Variation in the y variable which is not explained by the Regression Model. 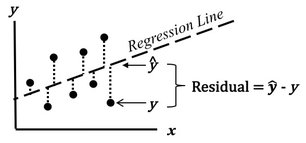 So, Residuals must be Random. If not -- if Residuals form a pattern -- that is evidence that one or more additional Factors (x's) influence y. A Scatterplot of Residuals against y-values should illustrate Randomness: 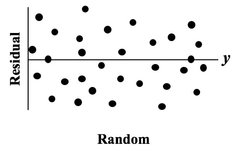 Being Random means that the Residuals
Here are a couple of patterns which indicate the Regression Model is incomplete. 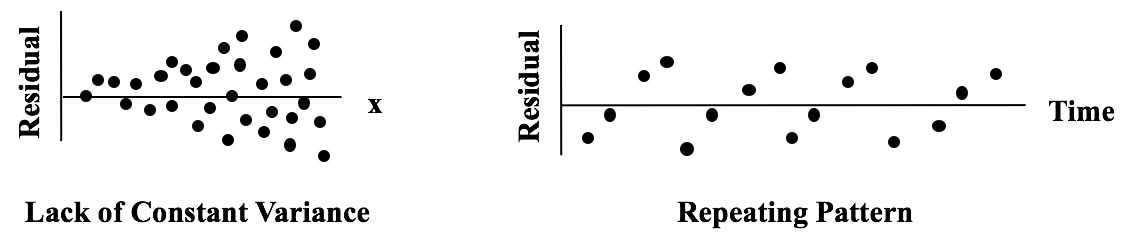 One of the things which make statistics confusing is the confusing language. For example, there is the triple negative of "Fail to Reject the Null Hypothesis". Then there are several instances where a single concept has multiple names. And this Tip of the Week is about what one might call an "asymmetry" in names for statistical concepts. 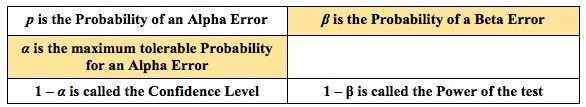
So, what is Alpha? First of all, the person performing the a statistical test selects the value of Alpha. Alpha is (called the "Significance Level"). It is 1 minus the Confidence Level. 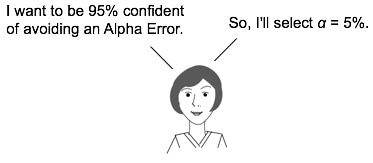 Alpha is the maximum value for p (the probability of an Alpha Error) which the tester is willing to tolerate and still call the test results "Statistically Significant".
For more on Alpha and p you can view 2 videos on my YouTube channel. Links: This video: https://youtu.be/2fz0STTfIIU Channel: bit.ly/2dD5H5f This is the 4th of 5 videos in a playlist that describes 4 concepts at the heart of Inferential Statistics and how they work together. The first 3 were
Here are the 5 Keys to Understanding the concept of Test Statistic: 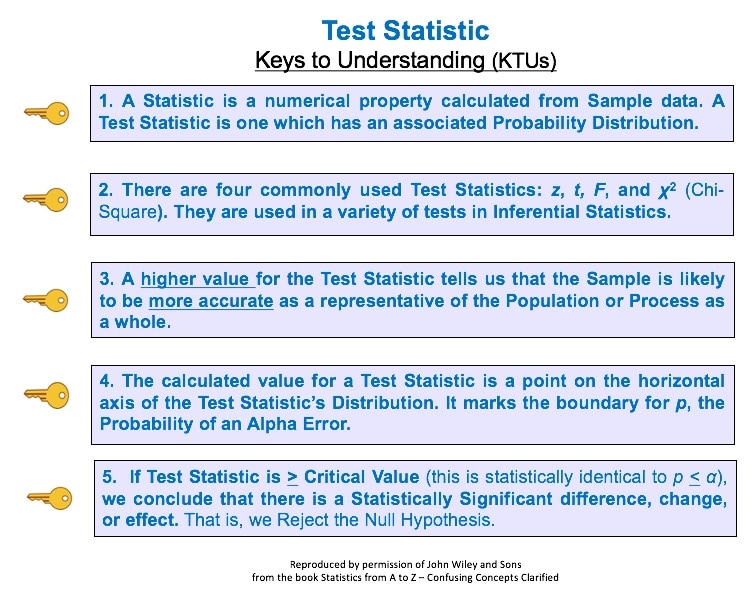 And here is a summary of the 4 Test Statistics and how they are used: 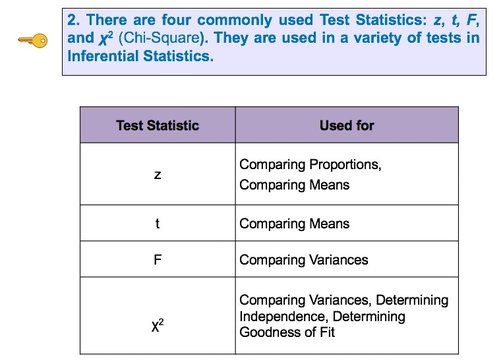 And here is a 1-page summary of the Test Statistic F: 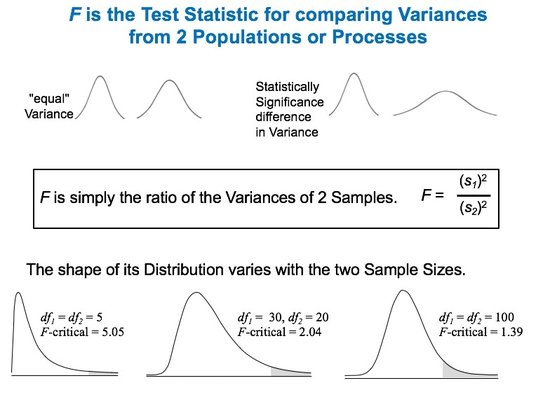 In the Tip of the Week for October 27, 2016, we listed a number of things that ANOVA can and can't do. One of these was that ANOVA can tell us whether or not there is a Statistically Significant difference among several Means, but it cannot tell us which ones are different from the others to a Statistically Significant amount. Let's say we're comparing 3 Groups (Populations or Processes) from which we've taken Samples of data. ANOM calculates the Overall Mean of all the data from all Samples, and then it measures the variation of each Group Mean from that. In the conceptual diagram below, each Sample is depicted by a Normal curve. The distance between each Sample Mean and the Overall Mean is identified as a "variation". 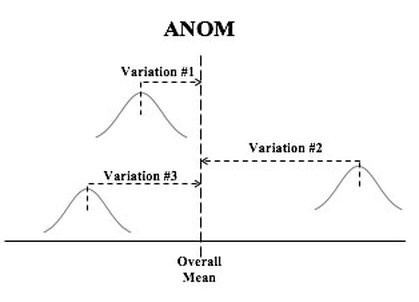 ANOM retains the identity of the source of each of these variations (#1, #2, and #3), and it displays this graphically in an ANOM chart like the one below. In this ANOM chart, we are comparing the defect rates in a Process at 7 manufacturing plants. So, there are 7 variations that are being compared. 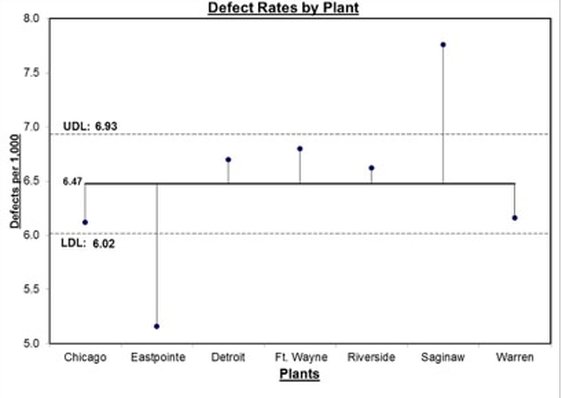 The dotted horizontal lines, the Upper Decision Line, UDL and Lower Decision Line, LDL, define a Confidence Interval, in this case, for α = 0.05. Our conclusion is that Eastpointe (on the low side) and Saginaw (on the high side) exhibit a Statistically Significant difference in their Mean defect rates. So ANOM tells us not only whether any plants are Significantly different, but also which ones are. In ANOVA, however, the individual identities of the Groups are lost during the calculations. 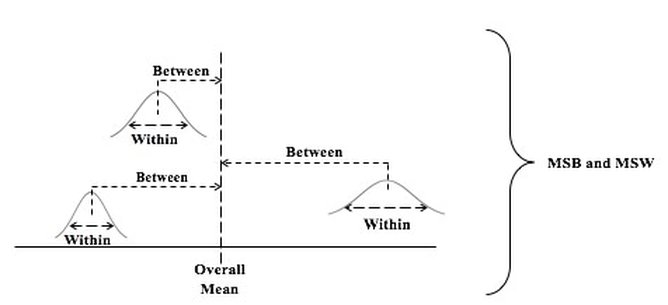 The 3 individual variations Between the individual Means and the Overall Mean are summarized into one Statistic, MSB, the Mean Sum of Squares Between. And the 3 variations Within each Group are summarized into another Statistic, MSW, the Mean Sum of Squares Within. So, there is no way to identify individual variations, we just have Means of the variations from the individual groups. Here's a summary of the calculations in ANOVA: 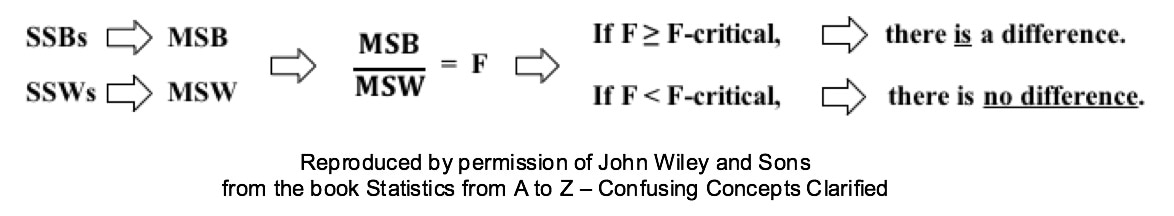
Statistics Tip of the Week: Establishing Correlation is a Prerequisite for Linear Regression2/1/2017 Establishing Correlation is a prerequisite for Linear Regression. We can't use Linear Regression unless there is a Linear Correlation. The following compare-and-contrast table may help in understanding both concepts. 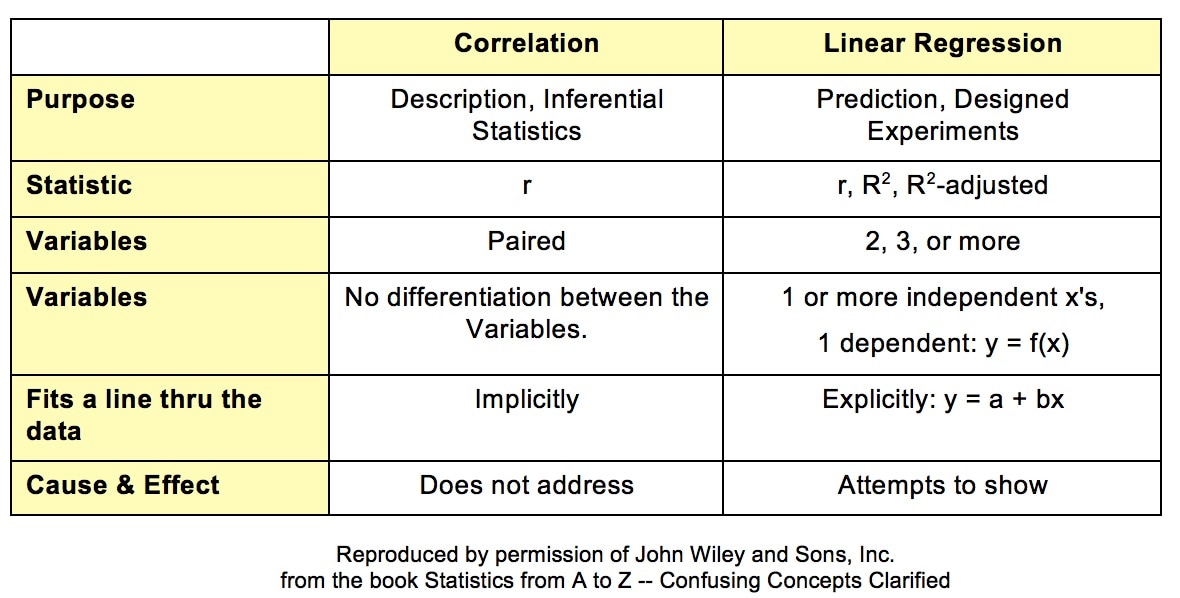 Correlation analysis describes the present or past situation. It uses Sample data to infer a property of the source Population or Process. There is no looking into the future. The purpose of Linear Regression, on the other hand, is to define a Model (a linear equation) which can be used to predict the results of Designed Experiments.
Correlation mainly uses the Correlation Coefficient, r. Regression also uses r, but employs a variety of other Statistics. Correlation analysis and Linear Regression both attempt to determine whether 2 Variables vary in synch. Linear Correlation is limited to 2 Variables, which can be plotted on a 2-dimensional x-y graph. Linear Regression can go to 3 or more Variables/ dimensions. In Correlation, we ask to what degree the plotted data forms a shape that seems to follow an imaginary line that would go through it. But we don't try to specify that line. In Linear Regression, that line is the whole point. We calculate a best-fit line through the data: y = a + bx. Correlation Analysis does not attempt to identify a Cause-Effect relationship, Regression does. |
AuthorAndrew A. (Andy) Jawlik is the author of the book, Statistics from A to Z -- Confusing Concepts Clarified, published by Wiley. Archives
March 2021
Categories |


 RSS Feed