Statistics Tip of the Week: There are 2 different Critical Values for a 2-sided Chi-Square test.8/30/2017 For 2-sided tests using the Test Statistics z and t, which have symmetrical Distributions, there is only one Critical Value. That Critical Value is added or subtracted from the Mean. Since Chi-Square’s Distributions are not symmetric, the areas under the curve at the left tail and the right tail side have different shapes,for a given value of that area. So, there are two different Critical Values -– an Upper and a Lower –- for a 2-sided Chi-Square test. 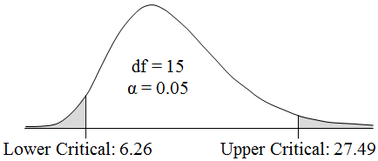 Unlike z and t, we do not add or subtract these Critical Values from the Mean. The two Critical Values of Chi-Square produced by tables, spreadsheets, or software are the final values to be used.
0 Comments
Statistics Tip of the Week: Simple Non-linear Regression fits a curve to non-linear x,y data.8/22/2017 The "Simple" means that there is only one x variable. y = f(x). So the curve exists in two dimension and can be plotted on screen or sheet of paper. The "non-linear" means that, when we graph the data, it does not roughly follow a straight line, so we must look for an appropriate curve. The following are probably the most common non-linear curves used: 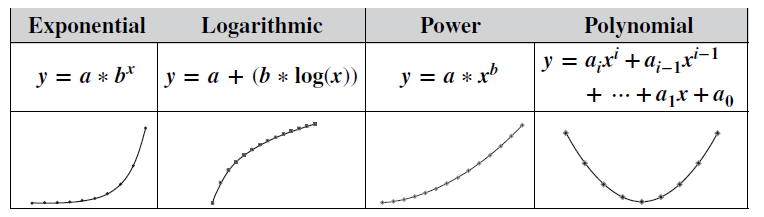 Exponential and Logarithmic curves have rapid accelerations or decelerations
in the slope. Power curves have a more gradual change. Polynomial functions can be used for more complex curves, which change direction, as shown in our Tip of the Week for May 17, 2017 Statistics Tip of the Week: an Exponential Distribution can be used with problems involving time.8/17/2017 The Exponential Distribution is useful for solving problems involving time to an event or time between events -- for example, time between emergency calls or time between equipment failures. It is especially useful with events that are relatively rare. If one were to analyze rare events per time period, using the Poisson Distribution, for example, the Counts might include a lot of zeros and an occasional 1. It may be more meaningful to think in terms of the time between events and measure the data that way. Then the Exponential Distribution could be used. 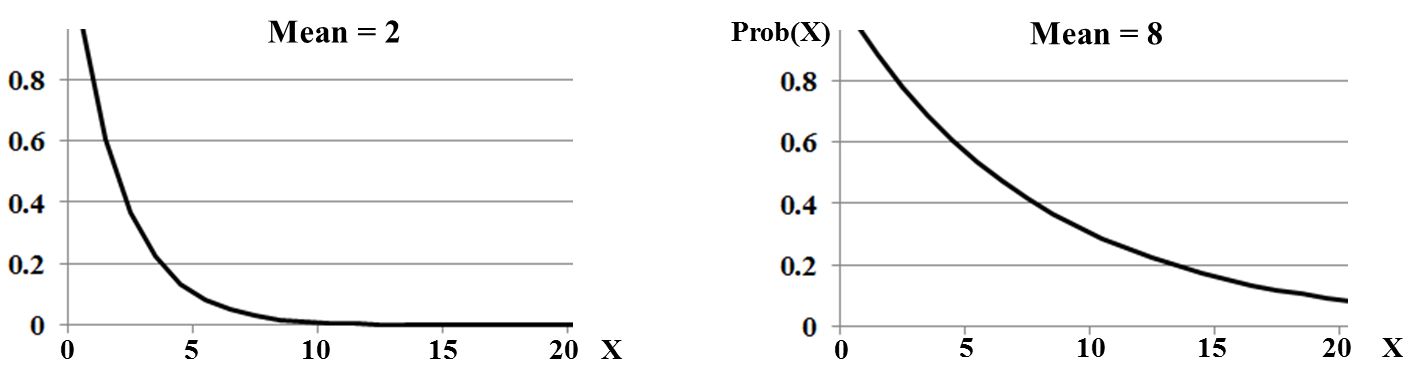 An individual Exponential Distribution can be specified by just one Parameter – either the Mean (µ), or the Rate (λ). λ = 1/ µ (If the Mean time to an event is 8 hours, then the Rate at which the events occur is 1/8 per hour.) An interesting fact about all Exponential Distributions: The Mean always splits the Cumulative Probabilities (areas under the curve) into 63% and 37%. 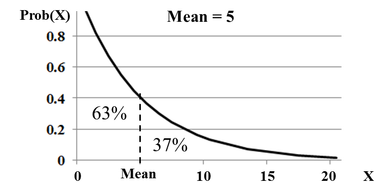 In our March 2, 2017 Tip of the Week, we discussed 2-Factor (aka 2-Way) ANOVA. We said that:
 For example, in the left diagram, above, both detergents behave the same way to a change in water temperature -- they show no change in their Effect -- cleanliness. Likewise, the middle and right diagrams show both detergents behaving the same -- a parallel increase in Effect. But what if we got something like the two graphs below? In the example at left, Detergent #1 shows a substantial increase in effectiveness as the water temperature is increased. But for Detergent #2, heating the water has the opposite effect: its effectiveness is decreased.  In the example on the right, both detergents show an increase in effectiveness as water temperature increases. But Detergent #2's increase is fairly minor. In fact, its increase may not be Statistically Significant and the Interaction may not be Statistically Significant..
In either case, we do have reason to suspect an Interaction. so 2-Way ANOVA Without Replication cannot be used. We must use 2-Way ANOVA With Replication. The With Replication method repeats (Replicates) the experiment several times for each combination of Factor A and B Values. This can provide sufficient data to quantify an Interaction. The number of Replications required to achieve a specified level of accuracy is determined by the methods of Design of Experiments, DOE. The Design also specifies the levels of each Factor to be used in each replication, the order of replication and other specifics of the experiment. The book has a 3-part series on DOE, and eventually there may be a video series on it as well. There is currently a video on the book's YouTube channel with more information about the subject of this post: ANOVA -- Part 4 (of 4): 2-Way (aka 2-Factor). 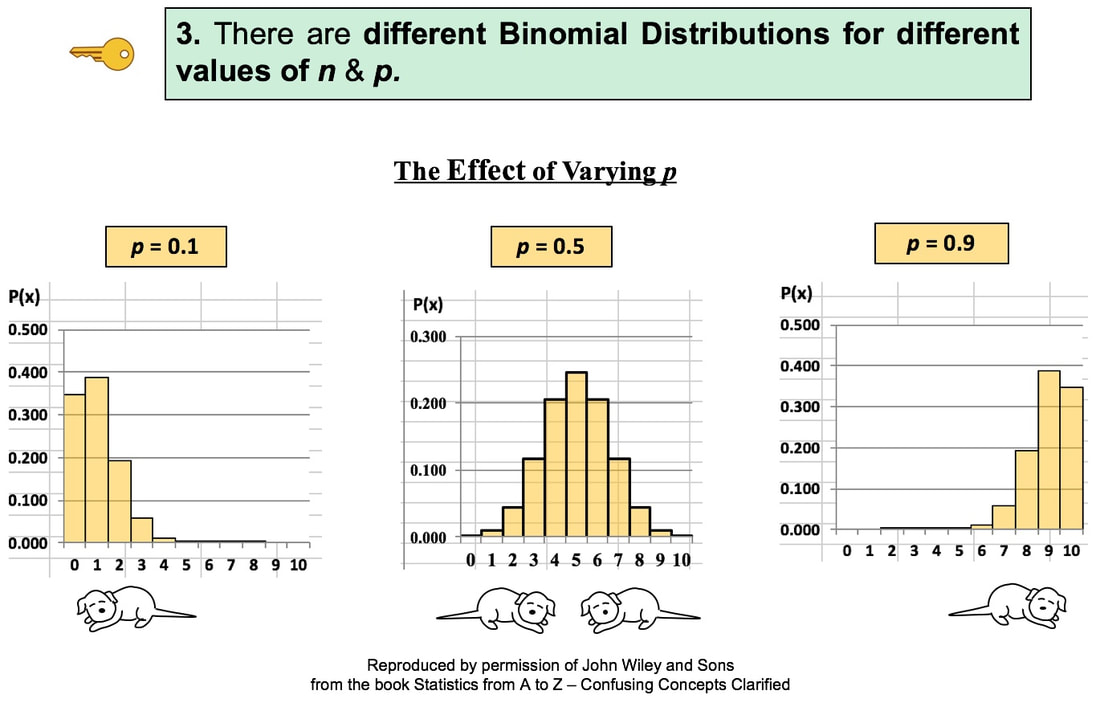 The video, like the article in the book, covers 6 Keys to Understanding the concept of Binomial Distribution.
It is part of a playlist which is eventually planned to include the following videos. The first 3 are done. See the videos page of this website for the latest status. •Probability Distributions – Part 1 (of 3): What they are •Probability Distributions – Part 2 (of 3): How they are used •Binomial Distribution •Poisson Distribution •Hypergeometric Distribution •Normal Distribution •t Distribution •F Distribution •Chi-Square Distribution •Exponential Distribution •Probability Distributions – Part 3 (of 3): Which to use when •Sampling Distribution •Skew, Skewness •Variation/ Variability/ Dispersion/ Spread Due to attending conferences, the folks at Wiley were not able to post my tip of the week last week on their FB and Twitter (which have a lot of followers). They'll do it this week. So, to avoid getting out of synch with them, I won't post a new tip this week.
|
AuthorAndrew A. (Andy) Jawlik is the author of the book, Statistics from A to Z -- Confusing Concepts Clarified, published by Wiley. Archives
March 2021
Categories |

 RSS Feed