Statistics Tip of the Week: How the selection of a value for Alpha specifies the Critical Value11/29/2018 In Hypothesis Testing, before the data is collected, a value for Alpha, the Level of Significance, is selected. The person performing the test selects the value. Most commonly, 5% is selected. Alpha is a Cumulative Probability -- the Probability of a range of values. It is shown as a shaded area under the curve of the Distribution of a Test Statistic, such as z.
If we have Distribution of a Test Statistic and a Cumulative Probability at one or both tails of the curve of the Distribution, software or tables will tell us the value of the Test Statistic which forms the boundary of the Cumulative Probability. In the above concept flow diagram, we show how selecting Alpha = 5% for a one-tailed (right tailed) test results in the Critical Value being 1.645. I earlier uploaded videos on the statistical concepts mentioned above to my YouTube channel: "Statistics from A to Z -- Confusing Concepts Clarified"
1 Comment
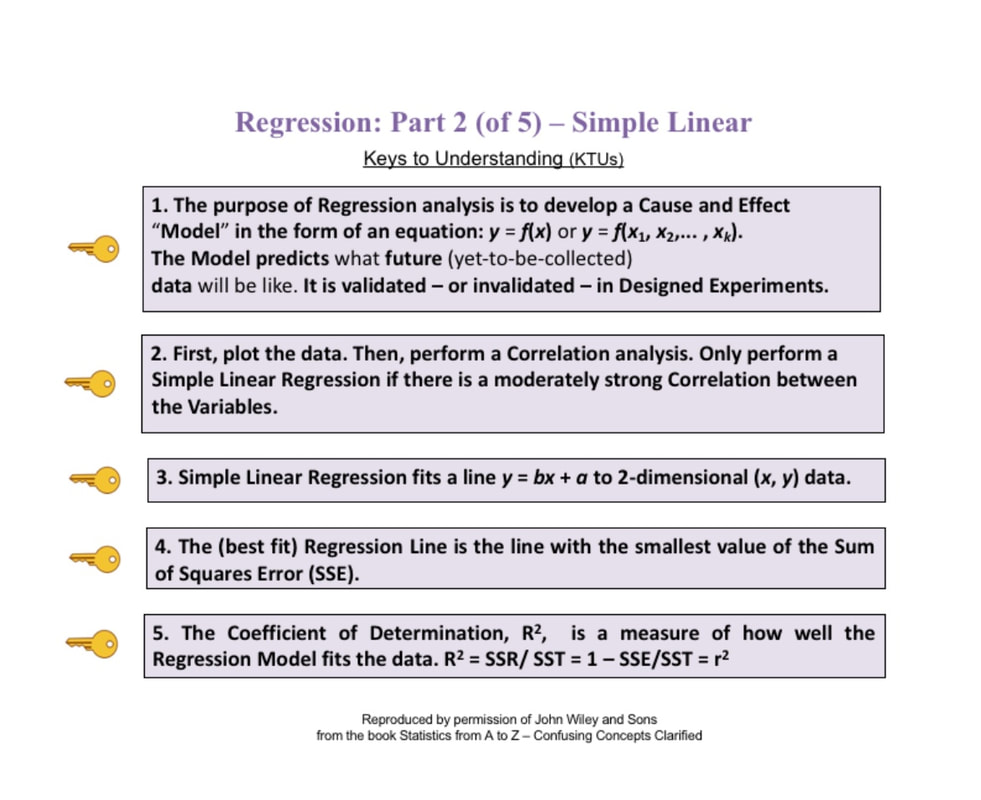
Continuing the playlist on Regression, I have uploaded a new video to YouTube; Regression -- Part 2: Simple Linear. See the videos page of this website for the status of completed and planned videos.
|
AuthorAndrew A. (Andy) Jawlik is the author of the book, Statistics from A to Z -- Confusing Concepts Clarified, published by Wiley. Archives
March 2021
Categories |


 RSS Feed