 Jay Arthur is the author of the books, Lean Six Sigma Demystified and Lean Six Sigma for Hospitals, as well as the creator of the QI Macros software for statistical process control. He says, "In college, I struggled with statistics. Professors seemed to want to teach us the 'what' and 'how' of statistics, but not the 'why.' They used 'not' language to describe results: 'We cannot reject the null hypothesis.' People struggle with understanding the meaning of sentences containing the word 'not'. I confess, I am one of them."
0 Comments
A nuclear fusion physicist at MIT told me he borrowed my book from the MIT Library -- which had 2 copies. He was very complimentary.
Statistics Tip of the Week: Designed Experiments provide strong evidence of cause and effect.5/25/2017 For a Process output, y, which is a function of several Factors (x's), that is, for 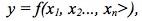 the Design of Experiments (DOE) discipline can design the most efficient and effective experiments to determine the values of the x's which produce the optimal value for -- or the minimal Variation in -- the Response Variable, y. DOE is active and controlling. (This can be done with Processes, but usually not with Populations). DOE doesn’t collect or measure existing data with pre-existing values for y and the x’s. DOE specifies Combinations of values for inputs (Factors) and then measures the resulting values of the outputs (Responses). This is the Design of the Experiment. Statistical software packages perform DOE calculations which specify the elements which make up the Design:
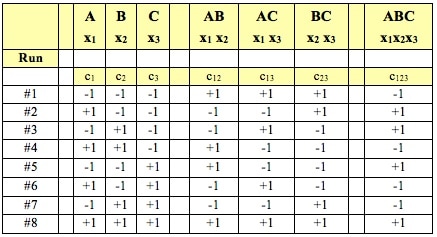 This is the 6th and final video in a playlist on ANOVA and related concepts. youtu.be/qcXzfVrj54E 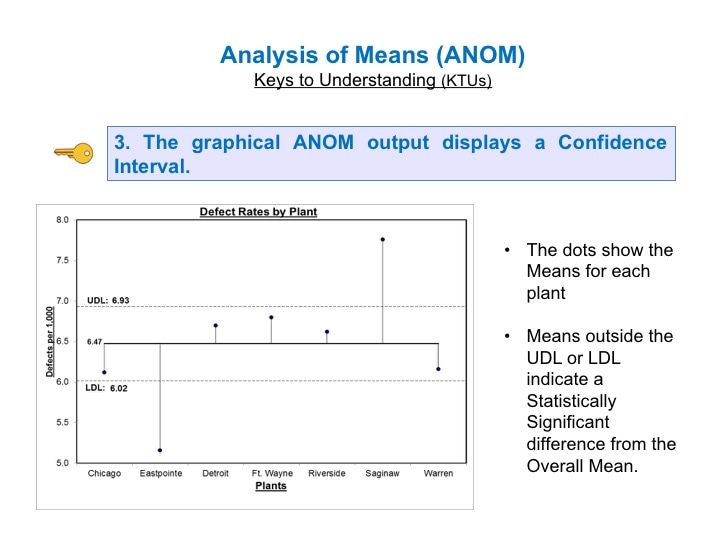 ANOM does something ANOVA cannot do. It not only tells us whether there is a statistically significant difference among several Means. It tells us which Means are different.
For a current status of available and planned videos, see the "Videos" page on this website.  The "Simple" in "Simple Nonlinear" means that there is only one x Variable in the formula of the formula e.g. y = f(x). The "nonlinear" means that we have determined that a straight line will not fit the data. We need to use some kind of curve -- e.g. Exponential, Logarithmic, Power, Polynomial, or some other type. A Polynomial has a formula  Note that there is just one x Variable, but it is raised to various powers, starting with the power of 2. (If there were only a power of 1, the equation would be that of a straight line.) The b's are Coefficients and the a is an Intercept. A "2nd degree", also known as "2nd order" or "Quadratic", Polynomial is of the form: 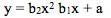 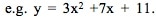 A 2nd order Polynomial has 1 change in direction. As x increases, y increases and then decreases (or y decreases and then increases). Two examples are pictured above. These shapes are Parabolas. A "3rd degree", aka "3rd order" aka Cubic" Polynomial has an x cubed term and changes direction twice. A kth degree Polynomial has k – 1 changes in direction. Simpler is better. It is usually not necessary to go beyond 3 orders. Larger orders are harder to work with. Also, they may be too closely associated with the idiosyncracies of the data provided in a particular Sample, and they may not be generally applicable to data in other Samples from the same Population or Process. Reproduced by permission of John Wiley and Sons, Inc
from the book, Statistics from A to Z -- Confusing Concepts Clarified From the Minitab Blog 10 Statistical Terms Designed to Confuse Non-Statisticians A Statistic is a numerical property of a Sample, for example, the Sample Mean or Sample Variance. A Statistic is an estimate of the corresponding property (“Parameter”) in the Population or Process from which the Sample was drawn. Being an estimate, it will likely not have the exact same value as its corresponding population Parameter. The difference is the error in the estimation. So, if we calculate a Statistic entirely from data values, there is a certain amount of error. For example, the Sample Mean is calculated entirely from the values of the Sample data. It is the sum of all the data values in the Sample divided by the number, n, of items in the Sample. There is one source of error in its formula – the fact that it is an estimate because it does not use all the data in the Population or Process. 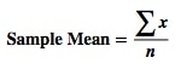 If we then use that Statistic to calculate another Statistic, it brings its own estimation error into the calculation of the second Statistic. This error is in addition to the second Statistic’s estimation error. This happens in the case of the Sample Variance. The numerator of the formula for Sample Variance includes the Sample Mean. It takes each data value (the x’s) in the Sample and subtracts from it the Sample Mean, squares it. Then it sums all those subtracted values. So, the Sample Variance has two sources of error:
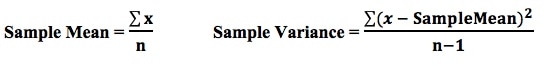 That is why the Degrees of Freedom for the Chi Square Test for the Variance is n - 1. Subtracting 1 from the n in the denominator results in a larger value for the Variance. This addresses the two sources of error. Here are the formulas for Degrees of Freedom for some Statistics and tests: 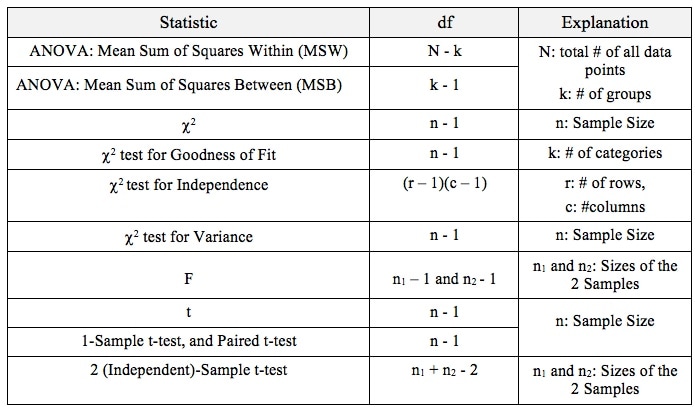 Gain a more intuitive understanding of the concepts of ANOVA and Regression by comparing and contrasting their similarities and differences. 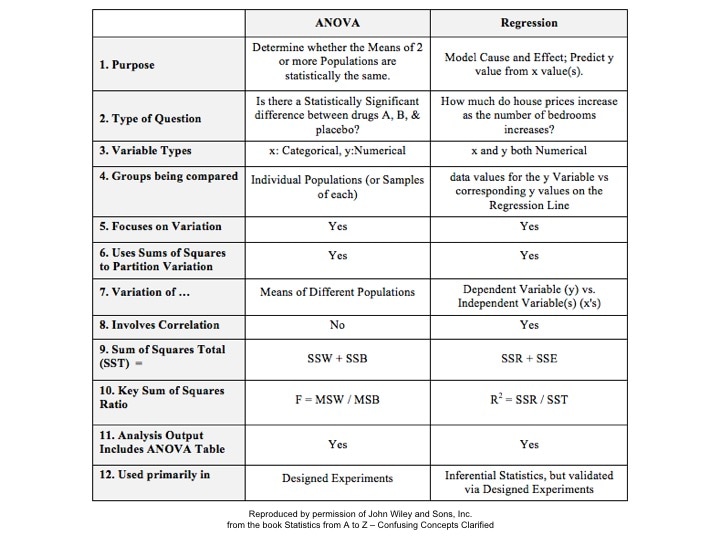 p is the Probability of an Alpha (False Positive) Error. Alpha (α) is the Level of Significance; its value is selected by the person performing the statistical test. If p < α (some say if p < α) then we Reject the Null Hypothesis. That is, we conclude that any difference, change, or effect observed in the Sample data is Statistically Significant. The p-value contains the same information as the Test Statistic Value, say z. That is because the value of z is used to determine the p-value. As shown in the following concept flow diagram,
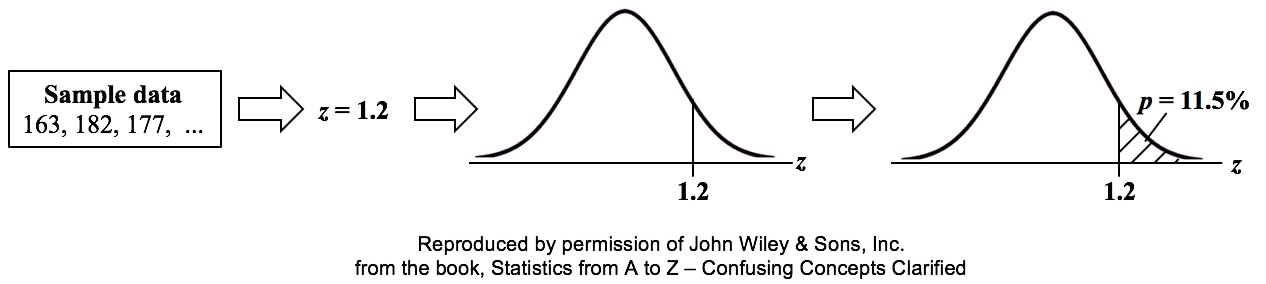 Similarly α contains the same information as the Critical Value. 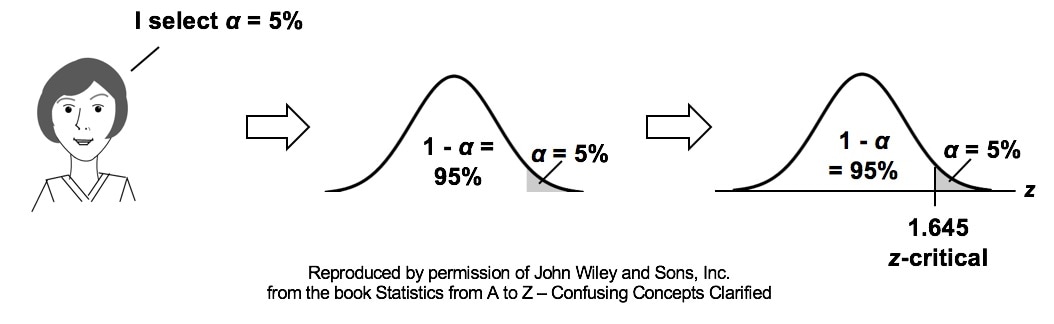 So comparing p and the Critical Value is the same as comparing Alpha and the Test Statistic value. But the comparison symbols ( ">" and "<") point in the opposite direction. That's because p and Test Statistic have an inverse relation. A smaller value for p means that the Test Statistic value must be larger. (See the blog post for March 30 of this year.) 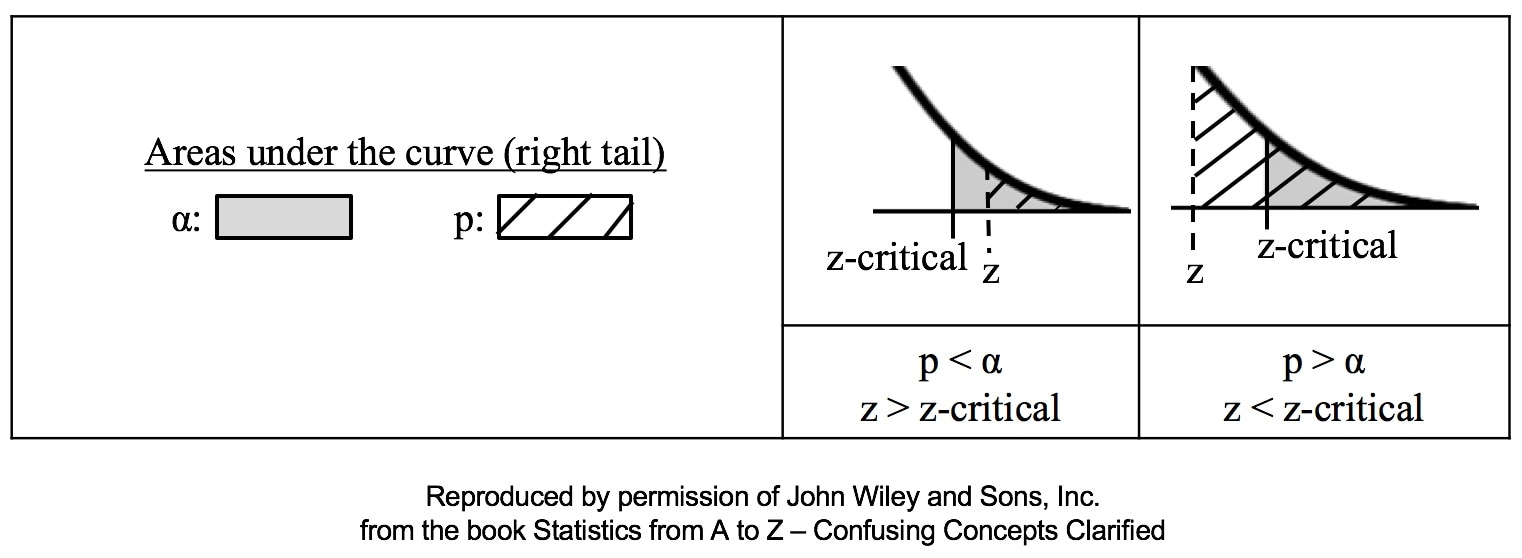 |
AuthorAndrew A. (Andy) Jawlik is the author of the book, Statistics from A to Z -- Confusing Concepts Clarified, published by Wiley. Archives
March 2021
Categories |


 RSS Feed