STATISTICS FROM A TO Z<br />-- CONFUSING CONCEPTS CLARIFIED
  • Home
    • Why This Book Is Needed
    • Articles List, Additional Concepts
    • Examples: 1-Page Summaries
    • Examples: Concept Flow Diagram
    • Examples: Compare and Contrast Tables
    • Examples: Cartoons
    • Example: Which to Use When Article
  • Buy
  • Blog
  • Sample Articles
  • Videos
  • Author
  • Communicate
  • Files
  • Errata

Statistics Tip of the Week: p < Alpha is the same as Test Statistic > Critical Value

5/3/2017

1 Comment

 
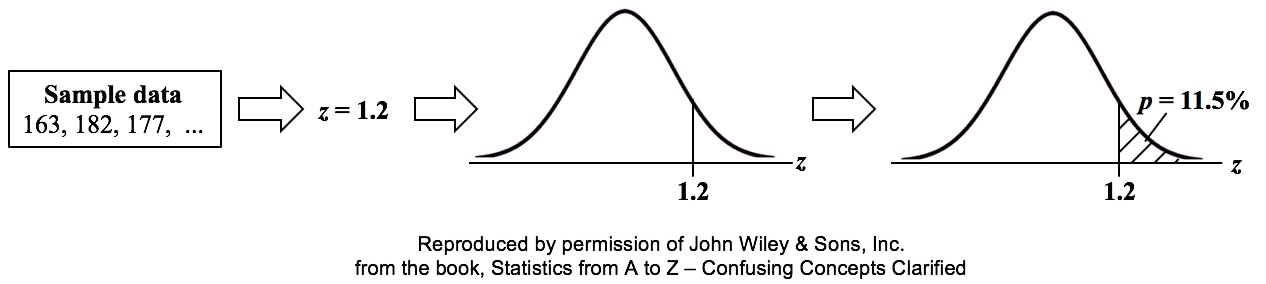
p is the Probability of an Alpha (False Positive) Error. Alpha (α) is the Level of Significance; its value is selected by the person performing the statistical test. If p < α (some say if p < α) then we Reje​ct the Null Hypothesis. That is, we conclude that any difference, change, or effect observed in the Sample data is Statistically Significant. 

The p-value contains the same information as the Test Statistic Value, say z. That is because the value of z is used to determine the p-value. As shown in the following concept flow diagram,
  1. Sample data is used to calculate a value for a Test Statistic, say, z.
  2. This value of z forms the boundary for the area under the curve which represents the Cumulative Probability, p.
  3. From this, tables or calculations give us the value of p.
Picture
Similarly α contains the same information as the Critical Value. 
Picture
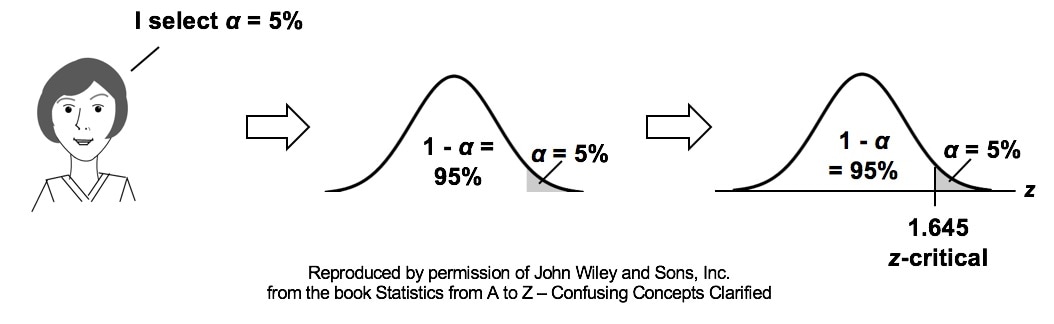
So comparing p and the Critical Value is the same as comparing Alpha and the Test Statistic value. But the comparison symbols ( ">" and  "<") point in the opposite direction. That's because p and Test Statistic have an inverse relation. A smaller value for p means that the Test Statistic value must be larger. (See the blog post for March 30 of this year.)
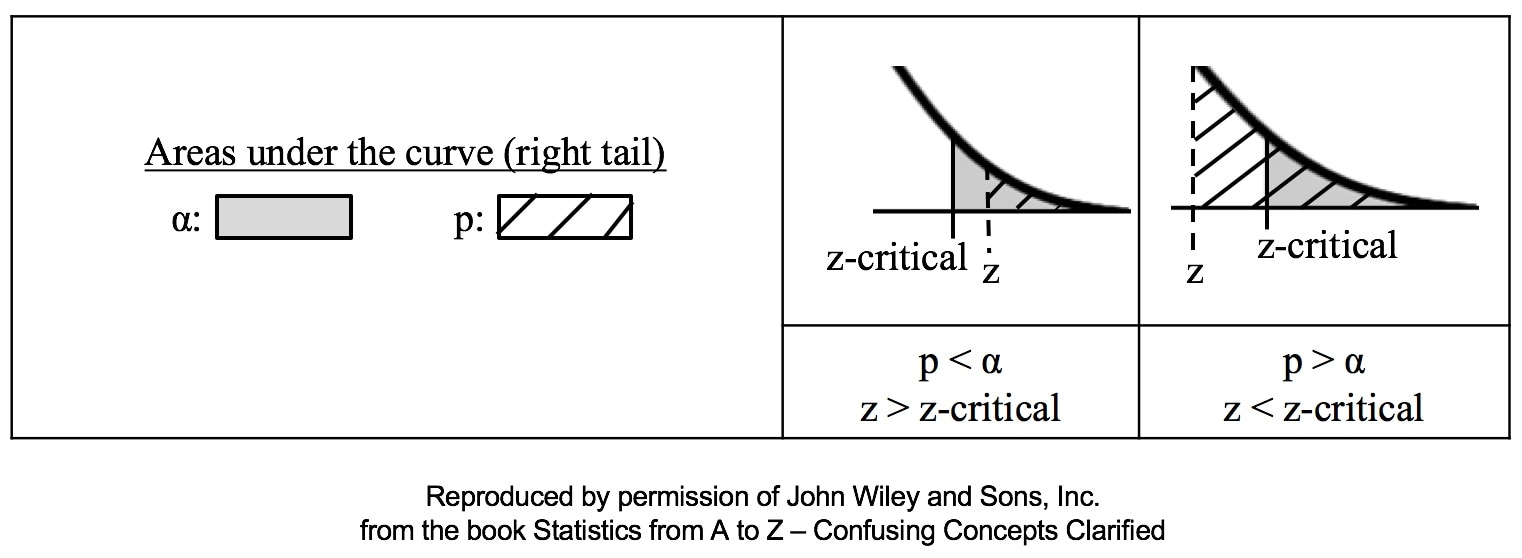
Picture
See also the videos for
  • p, the p-value​
  • Alpha (α), the Significance Level
  • Null Hypothesis
  • Reject the Null Hypothesis
  • Critical Value
  • Test Statistic
1 Comment
mahmoudi
6/1/2018 01:45:36 pm

je peut faire un stage de spss

Reply


Leave a Reply.

    Author

    Andrew A. (Andy) Jawlik is the author of the book, Statistics from A to Z -- Confusing Concepts Clarified, published by Wiley.

    Archives

    March 2021
    December 2020
    November 2020
    October 2020
    September 2020
    August 2020
    May 2020
    March 2020
    February 2020
    January 2020
    December 2019
    November 2019
    October 2019
    September 2019
    July 2019
    June 2019
    May 2019
    April 2019
    March 2019
    February 2019
    January 2019
    December 2018
    November 2018
    October 2018
    September 2018
    August 2018
    July 2018
    June 2018
    May 2018
    April 2018
    March 2018
    February 2018
    January 2018
    December 2017
    November 2017
    October 2017
    September 2017
    August 2017
    July 2017
    June 2017
    May 2017
    April 2017
    March 2017
    February 2017
    January 2017
    December 2016
    November 2016
    October 2016
    September 2016
    August 2016

    Categories

    All
    New Video
    Stats Tip Of The Week
    You Are Not Alone

    RSS Feed

  • Home
    • Why This Book Is Needed
    • Articles List, Additional Concepts
    • Examples: 1-Page Summaries
    • Examples: Concept Flow Diagram
    • Examples: Compare and Contrast Tables
    • Examples: Cartoons
    • Example: Which to Use When Article
  • Buy
  • Blog
  • Sample Articles
  • Videos
  • Author
  • Communicate
  • Files
  • Errata