|
There are 3 categories of numerical properties which describe a Probability Distribution (e.g. the Normal or Binomial Distributions).
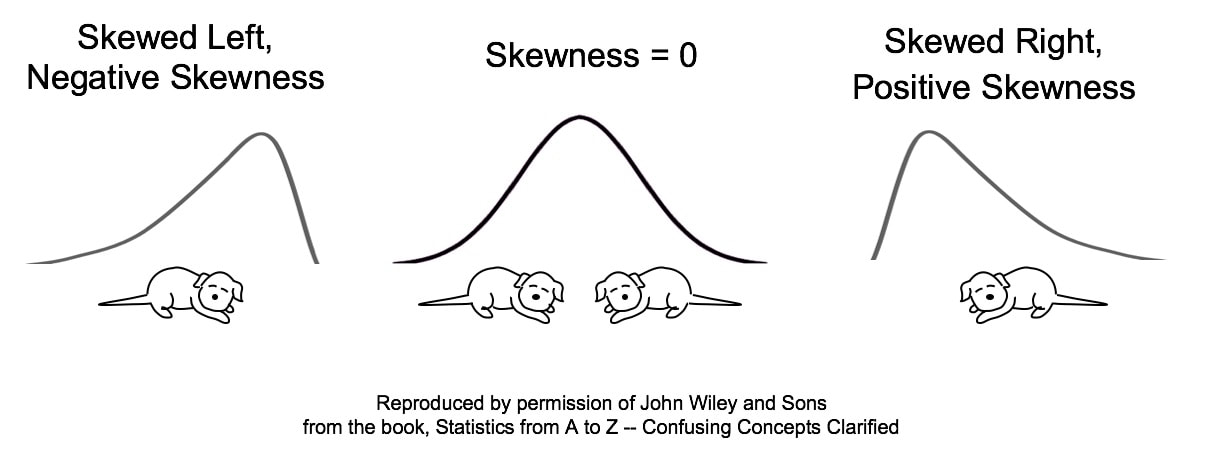 Skewness is a case in which common usage of a term is the opposite of statistical usage. If the average person saw the Distribution on the left, they would say that it's skewed to the right, because that is where the bulk of the curve is. However, in statistics, it's the opposite. The Skew is in the direction of the long tail.
If you can remember these drawings, think of "the tail wagging the dog."
0 Comments
New Video: Standard Error. See the Videos pages of this website for a listing of available and planned videos. 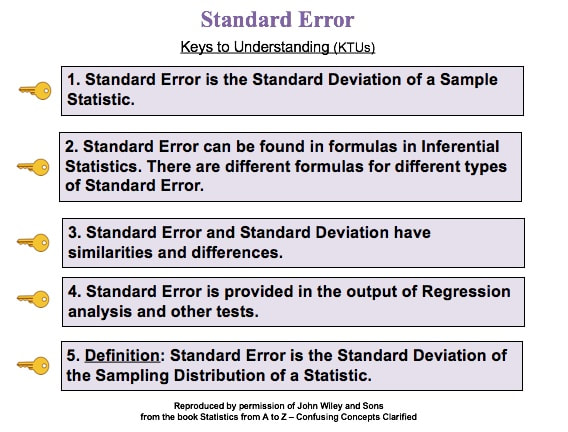  Many folks are confused about this, especially since the names for these tests themselves can be misleading. What we're calling the "2-Sample t-test" is sometimes called the "Independent Samples t-test". And what we're calling the "Paired t-test" is then called the "Dependent Samples t-test", implying that it involves more than one Sample. But that is not the case. It is more accurate -- and less confusing -- to call it the Paired t-test. 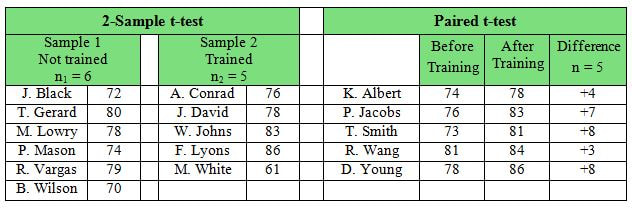 First of all, notice that the 2-Sample test, on the left, does have 2 Samples. We see that there are two different groups of test subjects involved (note the names are different) -- the Trained and the Not Trained. The 2-Sample t-test will compare the Mean score of the people who were not trained with the Mean score of different people who were trained.
The story with the Paired Samples t-test is very different. We only have one set of test subjects, but 2 different conditions under which their scores were collected. For each person (test subject), a pair of scores -- Before and After -- was collected. (Before-and-After comparisons appear to be the most common use for the Paired test.) Then, for each individual, the difference between the two scores is calculated. The values of the differences are the Sample (in this case: 4, 7, 8, 3, 8 ). And the Mean of those differences is compared by the test to a Mean of zero. For more on the subject, you can view my video, t, the Test Statistic and its Distributions. One would think that a chemical engineer would be pretty adept at technical things. And one with a PhD even more so. But, it seems that the confusion sowed by statistics knows no bounds. A PhD in chemical engineering recently told me, "I never did get the hang of statistics."
I just uploaded a new Video, "Standard Deviation". It is part of the playlist on Variation, Variability, Dispersion, and Spread. Below are the 5 Keys to Understanding for this concept. See the videos page of this website for the latest status of available and planned videos. 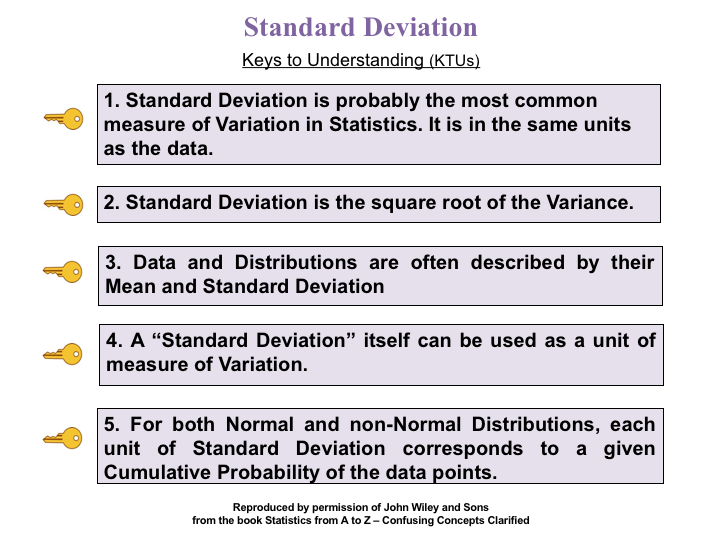 |
AuthorAndrew A. (Andy) Jawlik is the author of the book, Statistics from A to Z -- Confusing Concepts Clarified, published by Wiley. Archives
March 2021
Categories |

 RSS Feed