|
For many people, "Fail to Reject the Null Hypothesis" is one of the most confusing concepts in statistics. That's not surprising, because that phrase is a triple negative. It's like saying, "I don't not have no money". 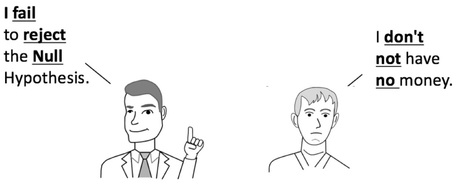 This new video uses a methodical approach and creative graphics to dissect the concept and make it understandable and "rememberable". This is the 5th and final video in the Hypothesis Testing playlist on my You Tube channel. See the Videos page on this website for what's next. 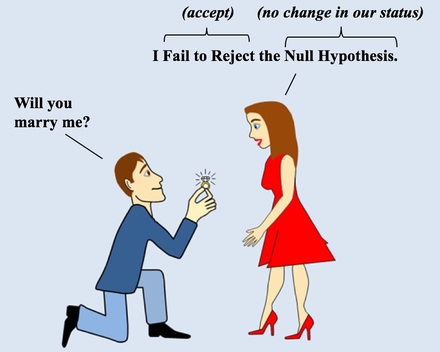
1 Comment
Statistics Tip of the Week: the values of a Categorical Variable are names of categories.11/23/2016 Categorical Variables are used in ANOMA, ANOVA, with Proportions, and in the Chi-Square Tests for Independence and Goodness of Fit. Categorical Variables are also known as "Nominal" (named) Variables and "Attributes" Variables. The concept can be confusing, because the values of a Categorical Variable are not numbers, but names of categories. The numbers associated with Categorical Variables come from counts of the data values within a named category. Here's how it works: 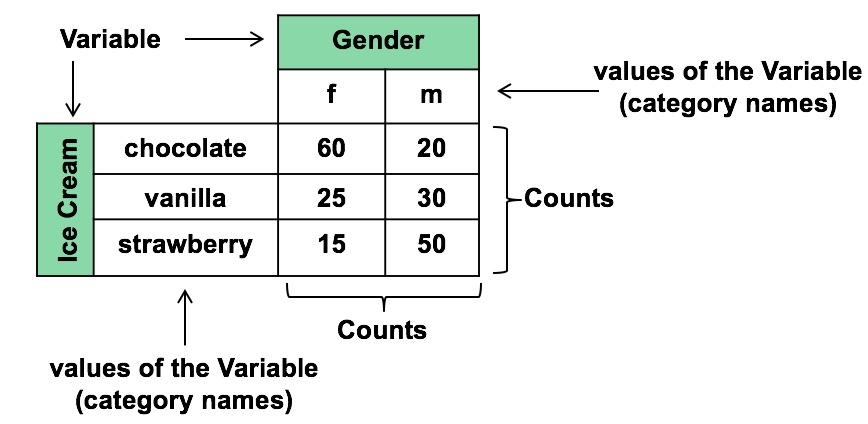
... at least on the display of works by local authors at our town library in Ridgefield, CT. Maurice Sendak, maybe the best and best-known children's book author of his time, lived in Ridgefield until his death in 2012.  The library has a display of painted cutout images of books by local authors. I have no idea how they decide what to place where. But it's nice to see my book there with his (even though, of course, I have no illusions that it belongs in that esteemed company).
Statistics Tip of the Week: How the selection of a value for Alpha specifies the Critical Value11/17/2016 In Hypothesis Testing, before the data is collected, a value for Alpha, the Level of Significance, is selected. The person performing the test selects the value. Most commonly, 5% is selected. 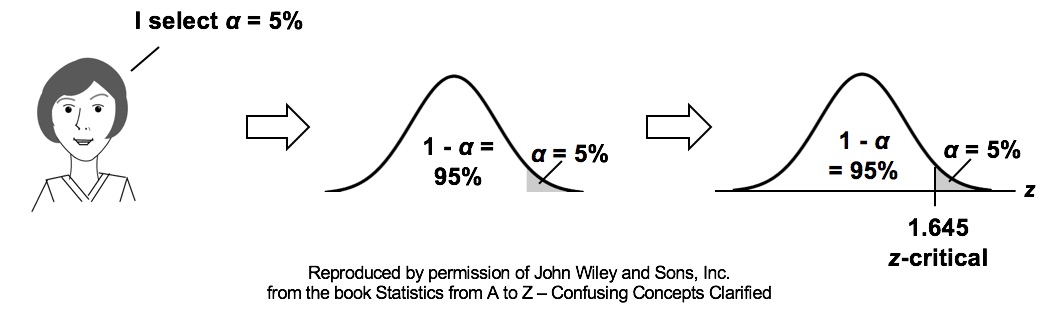 Alpha is a Cumulative Probability -- the Probability of a range of values. It is shown as a shaded area under the curve of the Distribution of a Test Statistic, such as z.
If we have Distribution of a Test Statistic and a Cumulative Probability at one or both tails of the curve of the Distribution, software or tables will tell us the value of the Test Statistic which forms the boundary of the Cumulative Probability. In this concept flow diagram, we show how selecting Alpha = 5% for a one-tailed (right tailed) test results in the Critical Value being 1.645. 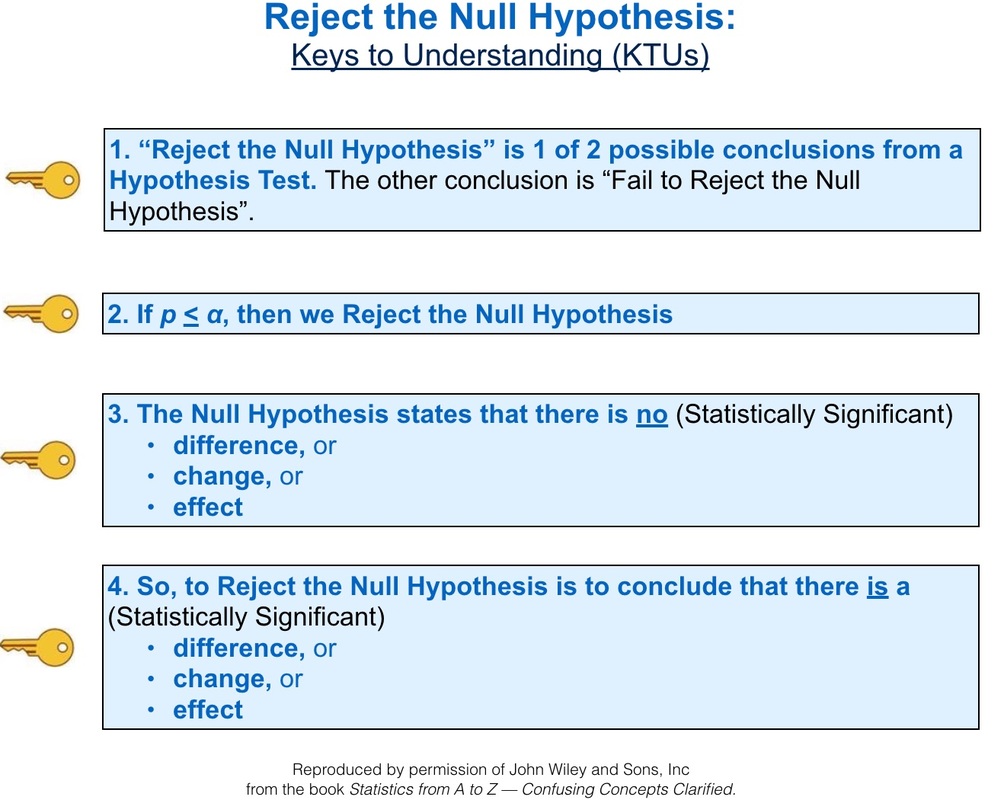 A new video Reject the Null Hypothesis is now available. This is the 4th video to be uploaded to my channel on You Tube. It will be added to the playlist for Hypothesis Testing. The 5th and final video in the playlist (Fail to Reject the Null Hypothesis) will be uploaded in 2 weeks. For many people, the two possible outcomes of a Hypothesis Test:
In both videos, we use a marriage proposal scenario -- among other things -- to illustrate the concept. The woman responds in the language of a statistician: 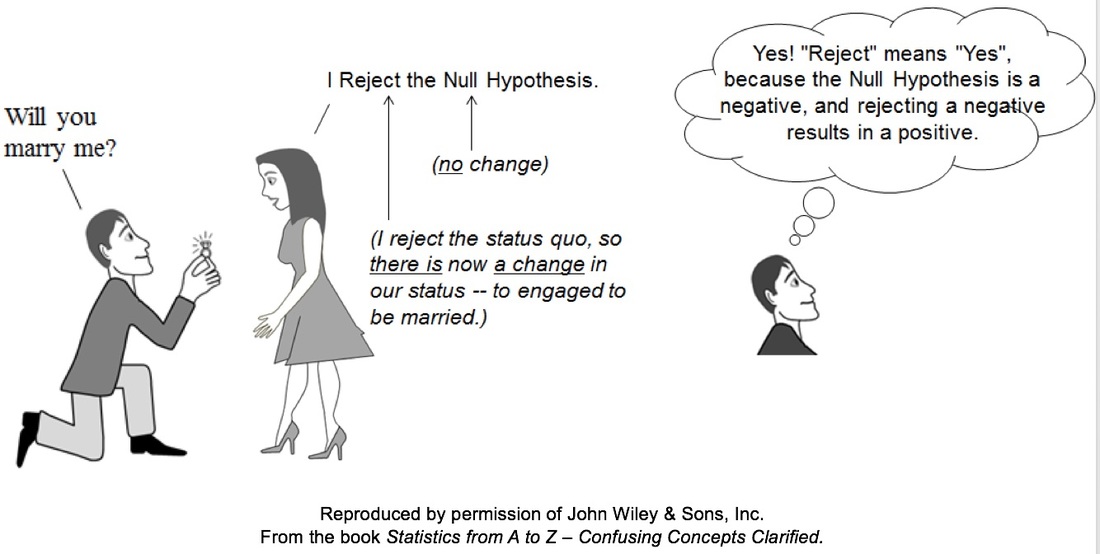 The Videos page on this website has the latest status of available and planned videos.
A Boxplot, also known as Box and Whiskers Plot, is a good way to visually depict Variation in a dataset (e.g., a Sample or Population). And showing several Boxplots vertically is useful for comparing Variation among several datasets. The boxes depict the range within which 50% of the data falls for each dataset.
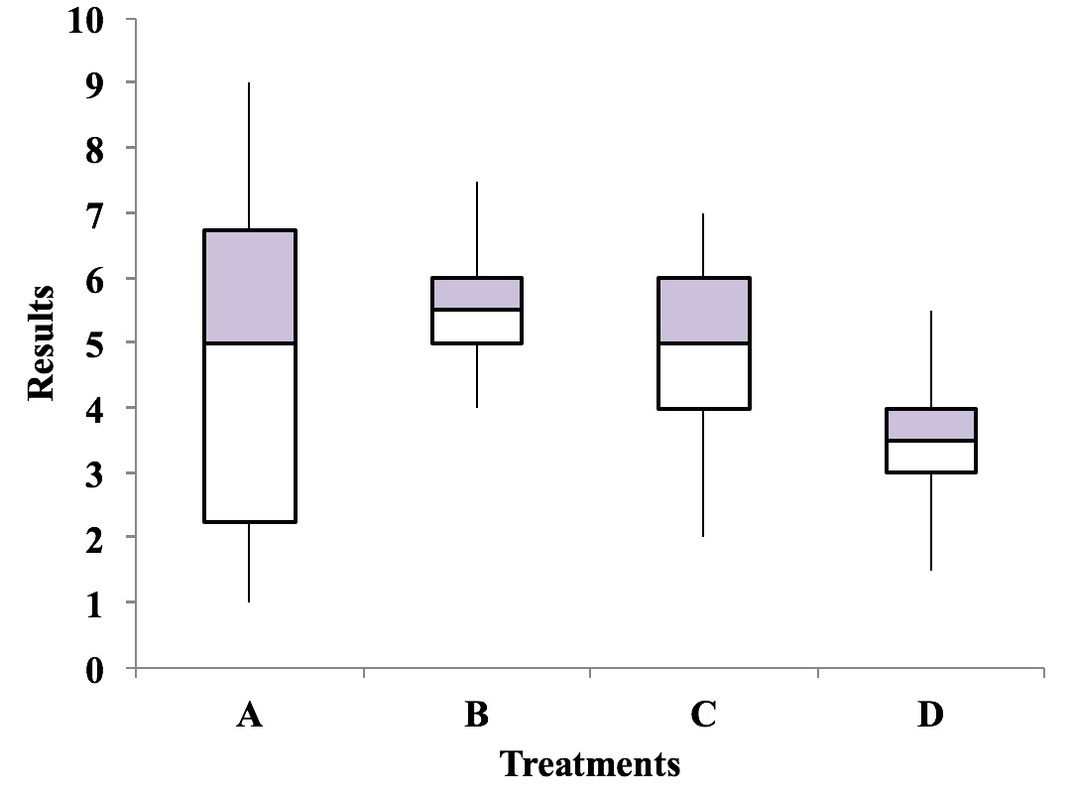 In this illustration, a higher score is better. Treatment A has the highest individual score, but it has considerable more Variation in results than Treatments B and C. The Medians for Treatments A, B, and C are fairly close. So, we can see at a glance that Treatment D can be eliminated from consideration. Treatment B has the highest Median and is gives very consistent results (small Variation). So, this plot may be all we need to select B as the best treatment.
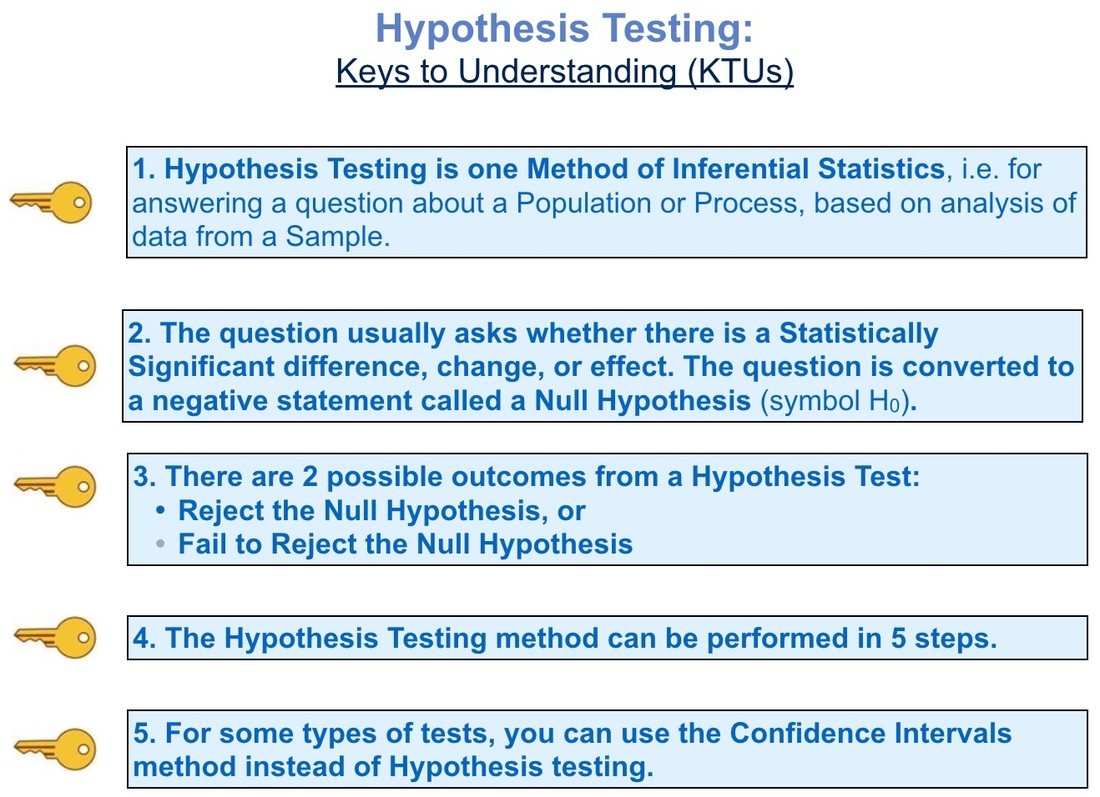 Hypothesis Testing is one of the two main methods of Inferential Statistics (statistics involving Samples). I've just uploaded a new video -- on Hypothesis Testing -- to my YouTube channel Statistics from A to Z -- Confusing Concepts Clarified. In the last two weeks, two videos on key concepts within Hypothesis Testing, the Null Hypothesis and the Alternative Hypothesis, were uploaded to the channel. In the coming weeks, two more videos will be uploaded to complete the playlist on Hypothesis Testing. These are Reject the Null Hypothesis and Fail to Reject the Null Hypothesis. 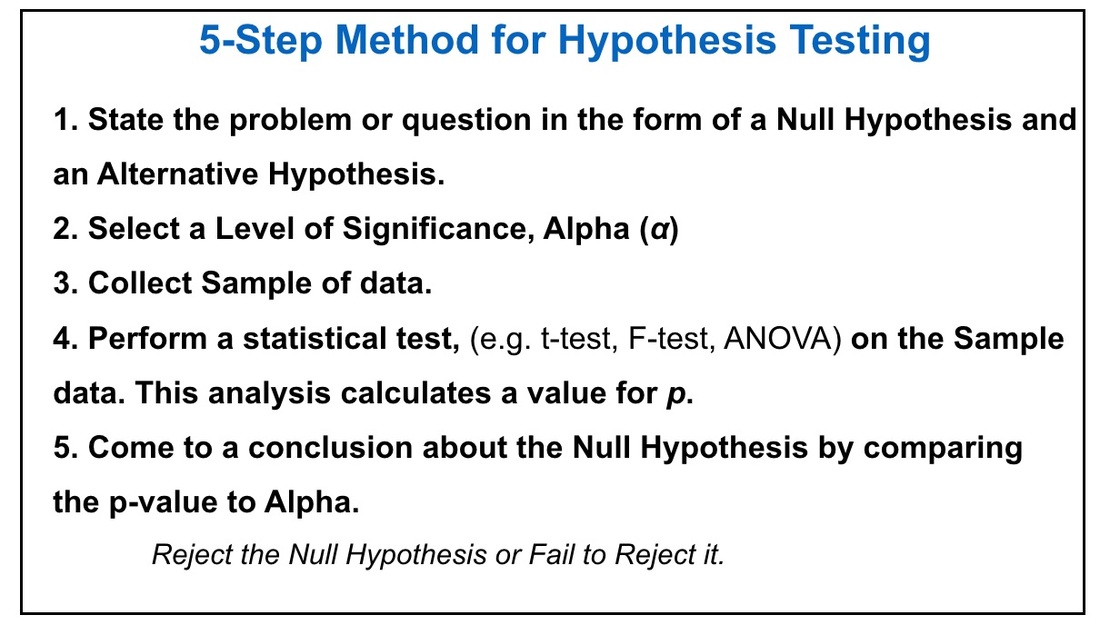 One of the requirements for using the Binomial Distribution is that each trial must be independent. One consequence of this is that the Sampling must be With Replacement. To illustrate this, let's say we are doing a study in a small lake to determine the Proportion of lake trout. Each trial consists of catching and identifying 1 fish. If it's a lake trout, we count 1. The population of the fish is finite. We don't know this, but let's say it's 100 total fish 70 lake trout and 30 other fish. Each time we catch a fish, we throw it back before catching another fish. This is called Sampling With Replacement. Then, the Proportion of lake trout is remains at 70%. And the Probability for any one trial is 70% for lake trout. 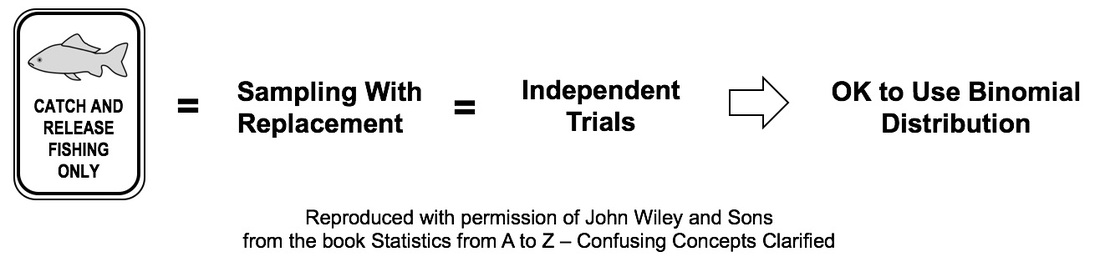 If, on the other hand, we keep each fish we catch, then we are Sampling Without Replacement. Let's say that the first 5 fish which we catch (and keep) are lake trout. Then, there are now 95 fish in the lake, of which 65 are lake trout. The percentage of lake trout is now 65/95 =68.4%. This is a change from the original 70%.
So, we don't have the same Probability each time of catching a lake trout. Sampling Without Replacement has caused the trials to not be independent. So, we can't use the Binomial Distribution. We must use the Hypergeometric Distribution instead. |
AuthorAndrew A. (Andy) Jawlik is the author of the book, Statistics from A to Z -- Confusing Concepts Clarified, published by Wiley. Archives
March 2021
Categories |

 RSS Feed