STATISTICS FROM A TO Z<br />-- CONFUSING CONCEPTS CLARIFIED
  • Home
    • Why This Book Is Needed
    • Articles List, Additional Concepts
    • Examples: 1-Page Summaries
    • Examples: Concept Flow Diagram
    • Examples: Compare and Contrast Tables
    • Examples: Cartoons
    • Example: Which to Use When Article
  • Buy
  • Blog
  • Sample Articles
  • Videos
  • Author
  • Communicate
  • Files
  • Errata

Statistics Tip of the Week: Use Boxplots to compare Variation in several datasets.

11/10/2016

0 Comments

 
A Boxplot, also known as Box and Whiskers Plot, is a good way to visually depict Variation in a dataset (e.g., a Sample or Population). And showing several Boxplots vertically is useful for comparing Variation among several datasets.
 
The boxes depict the range within which 50% of the data falls for each dataset.
  • The bottom of the box identifies the 25th percentile (25% of the data is below)
  • The line in the middle is the Median (50th percentile)
  • The top of the box is the 75th percentile
  • The line segments (the "whiskers") at the top and bottom extend to the highest and lowest values of the dataset. The whiskers are drawn to extend only as far as 1.5 box lengths. (If there are no data points that far out, the whisker ends at the farthest point.) Points beyond 1.5 box lengths are termed "Outliers". Points beyond 3 box lengths are called "Extremes" or "Extreme Outliers". 
Picture
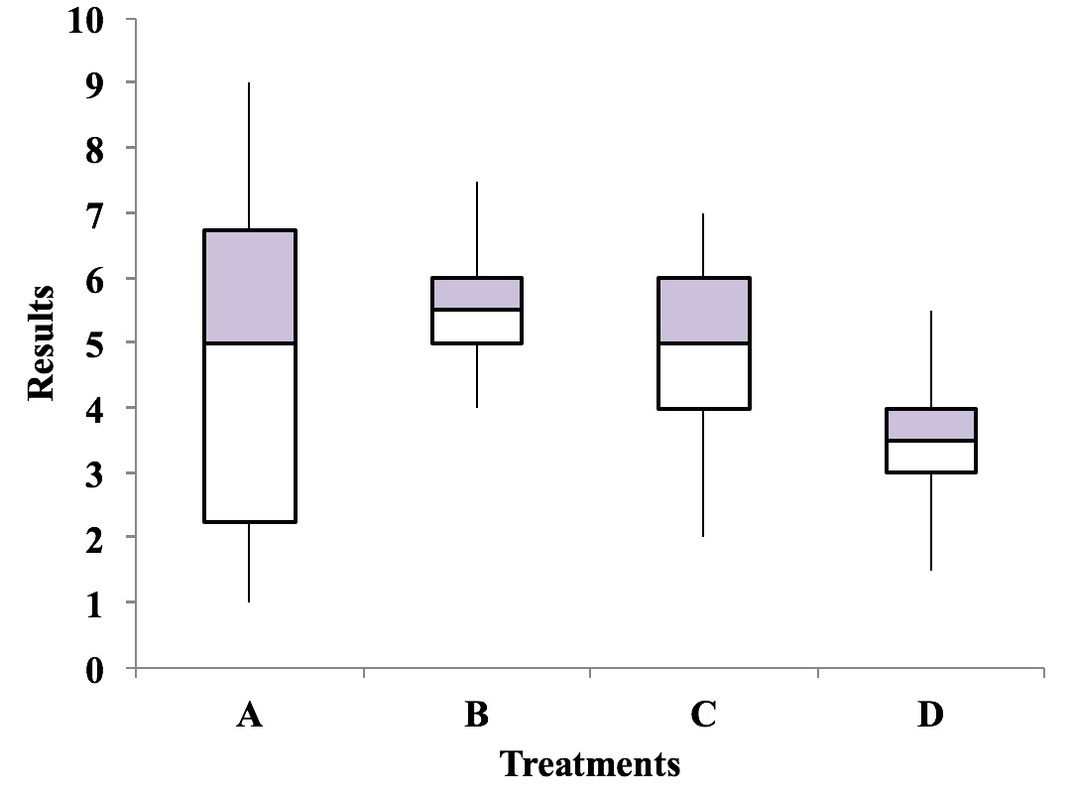
​In this illustration, a higher score is better. Treatment A has the highest individual score, but it has considerable more Variation in results than Treatments B and C. The Medians for Treatments A, B, and C are fairly close. So, we can see at a glance that Treatment D can be eliminated from consideration. Treatment B has the highest Median and is gives very consistent results (small Variation). So, this plot may be all we need to select B as the best treatment.
0 Comments


Leave a Reply.

    Author

    Andrew A. (Andy) Jawlik is the author of the book, Statistics from A to Z -- Confusing Concepts Clarified, published by Wiley.

    Archives

    March 2021
    December 2020
    November 2020
    October 2020
    September 2020
    August 2020
    May 2020
    March 2020
    February 2020
    January 2020
    December 2019
    November 2019
    October 2019
    September 2019
    July 2019
    June 2019
    May 2019
    April 2019
    March 2019
    February 2019
    January 2019
    December 2018
    November 2018
    October 2018
    September 2018
    August 2018
    July 2018
    June 2018
    May 2018
    April 2018
    March 2018
    February 2018
    January 2018
    December 2017
    November 2017
    October 2017
    September 2017
    August 2017
    July 2017
    June 2017
    May 2017
    April 2017
    March 2017
    February 2017
    January 2017
    December 2016
    November 2016
    October 2016
    September 2016
    August 2016

    Categories

    All
    New Video
    Stats Tip Of The Week
    You Are Not Alone

    RSS Feed

  • Home
    • Why This Book Is Needed
    • Articles List, Additional Concepts
    • Examples: 1-Page Summaries
    • Examples: Concept Flow Diagram
    • Examples: Compare and Contrast Tables
    • Examples: Cartoons
    • Example: Which to Use When Article
  • Buy
  • Blog
  • Sample Articles
  • Videos
  • Author
  • Communicate
  • Files
  • Errata