Statistics Tip: Alpha and p are Cumulative Probabilities; z and z-critical are point values.6/28/2018 Alpha, p, Critical Value, and Test Statistic are 4 concepts which work together in many statistical tests. In this tip, we'll touch on part of the story. The pictures below show two graphs which are close-ups of the right tail of a Normal Distribution. The graphs show the result of calculations in 2 different tests. 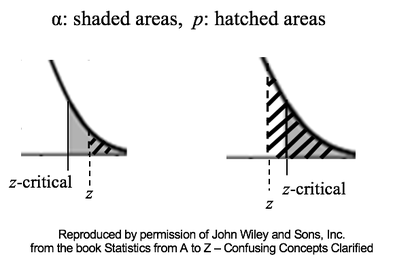 The horizontal axis shows values of the Test Statistic, z. So, z is a point value on this horizontal z-axis. z = 0 is to the left of these close-ups of the right tail. The value of z is calculated from the Sample data.
For more on how these four concepts work together, there is an article in the book, "Alpha, p, Critical Value and Test Statistic -- How They Work Together". I think this is the best article in the book. You can also see that article's content on my YouTube video. There are also individual articles and videos on each of the 4 concepts. My YouTube Channel is "Statistics from A to Z -- Confusing Concepts Clarified".
0 Comments
I just uploaded a new Video, "Variance". It is part of the playlist on Variation, Variability, Dispersion, and Spread. Below are the 6 Keys to Understanding for this concept. See the videos page of this website for the latest status of available and planned videos. 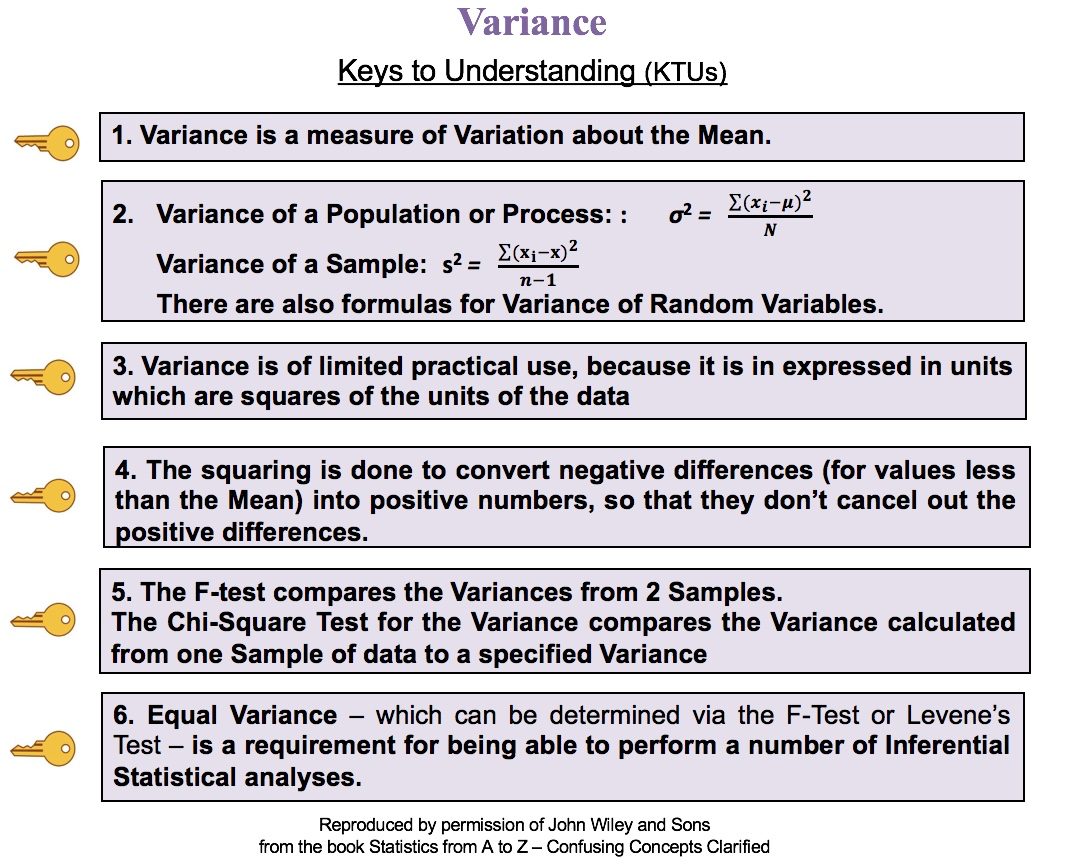 In ANOVA, Sum of Squares Total (SST) equals Sum of Squares Within (SSW) plus Sum of Squares Between. (SSB). That is, SST = SSW + SSB. In this Tip, we'll talk about Sum of Squares Within, SSW. In ANOVA, Sum of Squares Within (SSW) is the sum of Variations within each of several datasets or Groups. The following illustrations are not numerically precise. But, conceptually, they portray the concept of Sum of Squares Within as the width of the “meaty” part of a Distribution curve – the part without the skinny tails on either side. Here, SSW = SS1 + SS2 +SS3 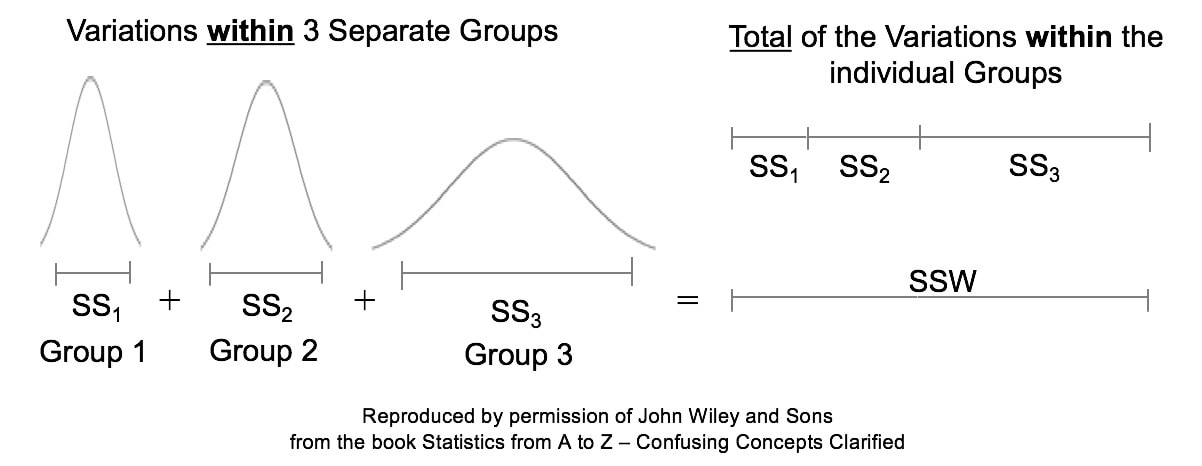 For more on Sums of Squares, see my video of that name: https://bit.ly/2JWMpoo .
For more on Sums of Squares within ANOVA, see my video, "ANOVA Part 2 (of 4): How It Does It: http://bit.ly/2nI7ScR . Sorry to have to say this, but errors have been found in the book. The errors and corrections are shown on the new "Errata" page on this website.
|
AuthorAndrew A. (Andy) Jawlik is the author of the book, Statistics from A to Z -- Confusing Concepts Clarified, published by Wiley. Archives
March 2021
Categories |


 RSS Feed