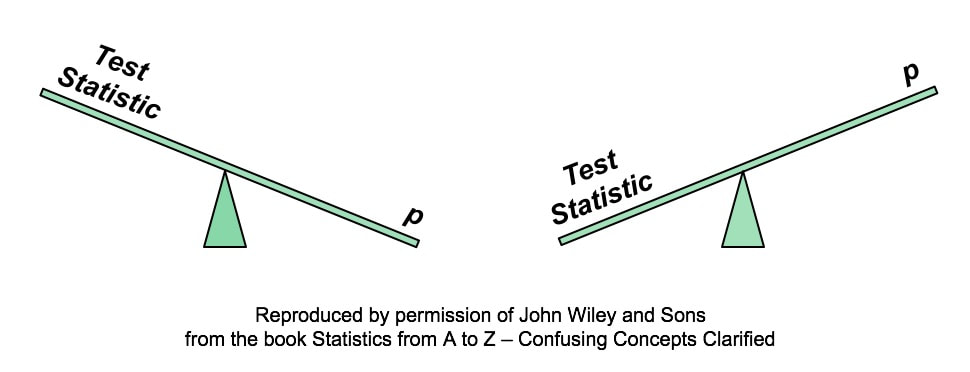
 A larger Test Statistic value (such as that for z, t, F, or Chi-Square) results in a smaller p-value. The p-value is the Probability of an Alpha (False Positive) Error. And conversely, a smaller Test Statistic value results in a larger value for p. Here's how it works:
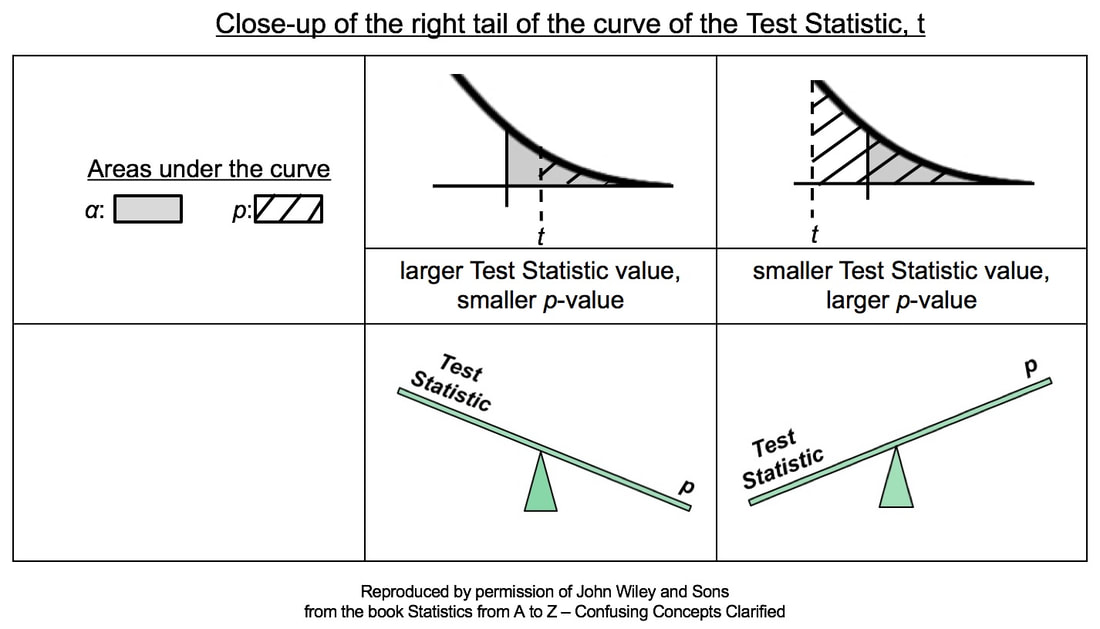 In the close-ups of the right tail, zero is not visible. It is the center of the bell-shaped t curve, and it is out of the picture to the left. So, a larger value of the Test Statistic, t, would be farther to the right. And, the hatched area under the curve representing the p-value would be smaller. This is illustrated in the middle column of the table above.
Conversely, if the Test Statistic is smaller, then it's value is plotted more to the left, closer to zero. And so, the hatched area under the curve representing p would be larger. This is shown in the rightmost column of the table.
0 Comments
Statistics Tip: In a 1-tailed test, the Alternative Hypothesis points in the direction of the tail1/2/2020 In the previous Tip, , we showed how to state the Null Hypothesis as an equation (e.g. H0: μΑ = μΒ). And the Alternative Hypothesis would be the opposite of that (HA: μA ≠ μB). These would work for a 2-tailed (2-sided) tests, when we only want to know whether there is a (Statistically Significant) difference between the two Means, not which one may be bigger than the other. But what about when we do care about the direction of the difference? This would be a 1-tailed (1-sided) test. And the Alternative Hypothesis will tell us whether it's right-tailed or left-tailed. (We need to specify the tail for our statistical calculator or software.) How does this work? First of all, it's helpful to know that the Alternative Hypothesis is also known as the "Maintained Hypothesis". The Alternative Hypothesis is the Hypothesis which we are maintaining and would like to prove. For example, We maintain that the Mean lifetime of the lightbulbs we manufacture is more than 1,300 hours. That is, we maintain that µ > 1,300. This, then becomes our Alternative Hypothesis. HA: µ > 1,300 Note that the comparison symbol of HA points to the right. So, this test is right-tailed. If, on the other hand, we maintained that the Mean defect rate of a new process is less than the Mean defect rate of the old process, our Maintained/ Alternative Hypothesis would be HA: µ New < µ Old and the test would be left-tailed. 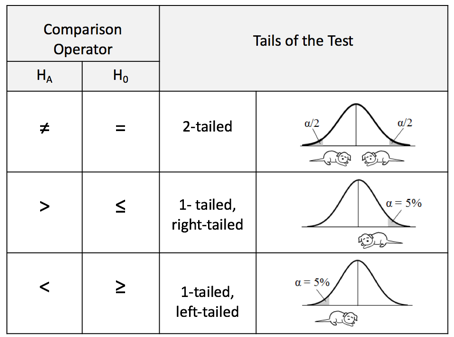 |
AuthorAndrew A. (Andy) Jawlik is the author of the book, Statistics from A to Z -- Confusing Concepts Clarified, published by Wiley. Archives
March 2021
Categories |

 RSS Feed