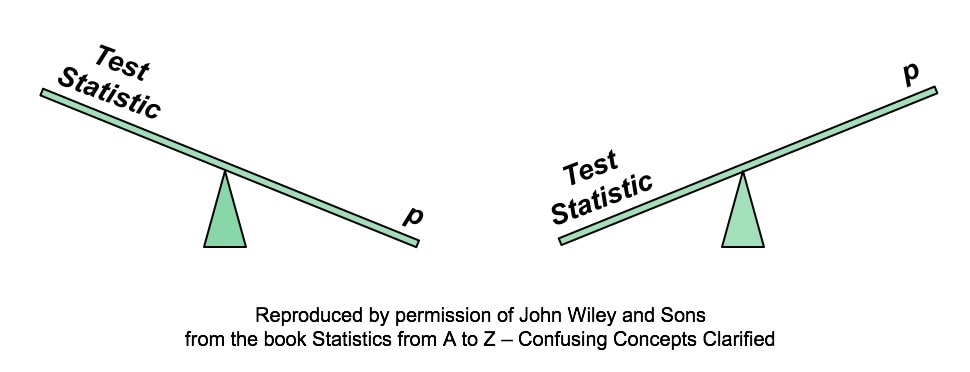
 A larger Test Statistic value (such as that for z, t, F, or Chi-Square) results in a smaller p-value. The p-value is the Probability of an Alpha (False Positive) Error. And conversely, a smaller Test Statistic value results in a larger value for p. Here's how it works:
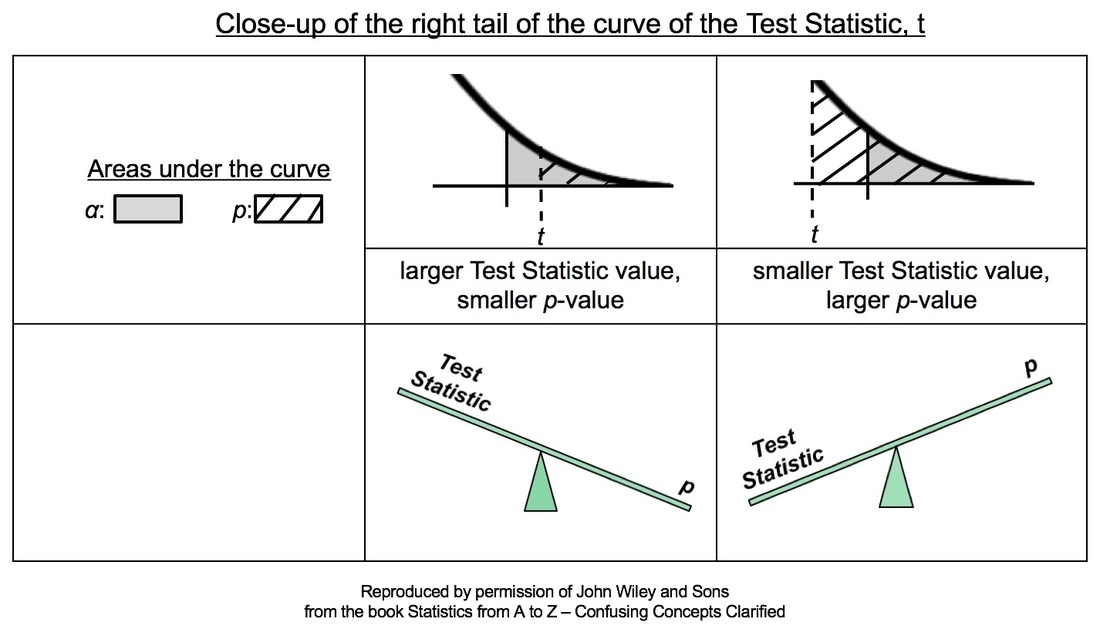 In the close-ups of the right tail, zero is not visible. It is at the center of the bell-shaped t curve, and it is out of the picture to the left. So, a larger value of the Test Statistic, t, would be farther to the right. And, the hatched area under the curve representing the p-value would be smaller. This is illustrated in the middle column of the table above.
Conversely, if the Test Statistic is smaller, then it's value is plotted more to the left, closer to zero. And so, the hatched area under the curve representing p would be larger. This is shown in the rightmost column of the table. For more on the concepts of Test Statistic and p-value, see my videos:
3 Comments
Here are the 5 Keys to Understanding from this video; 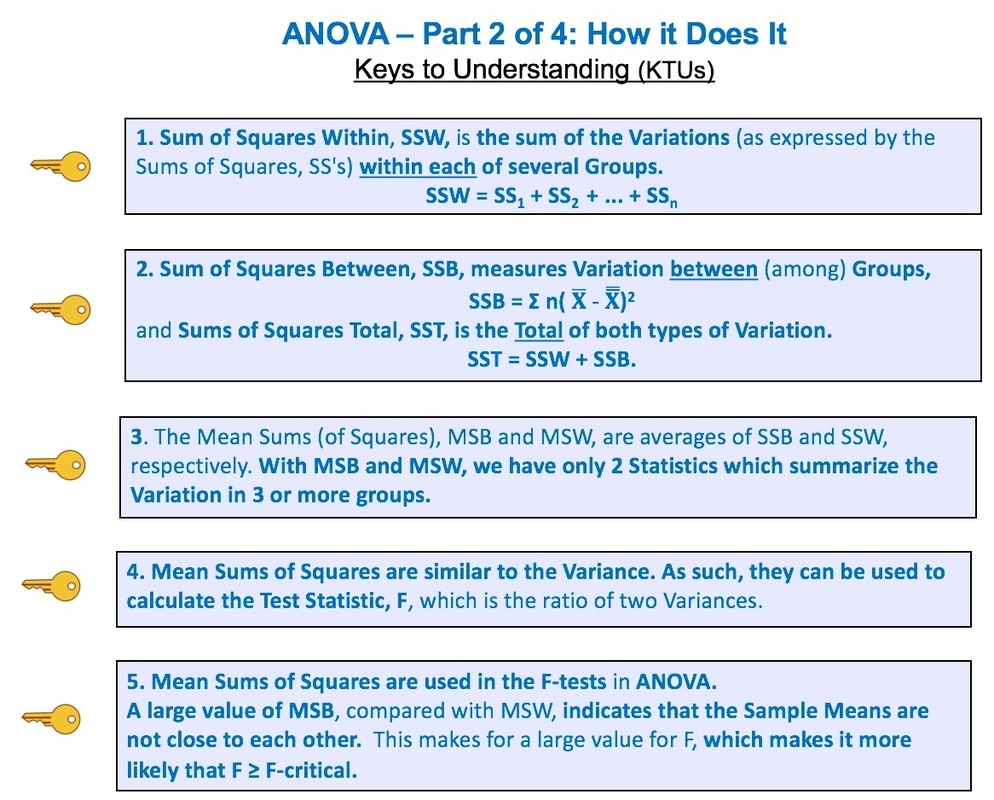 And here are some other graphics from this video.  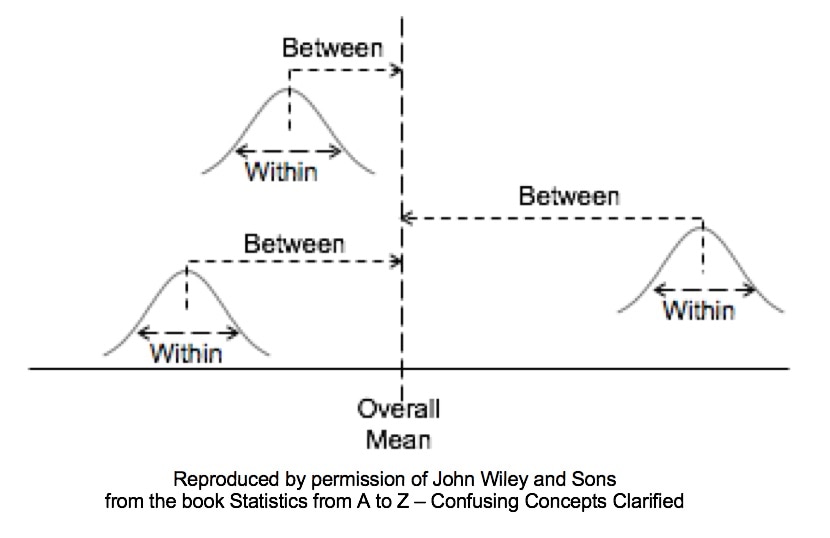 This is the 2nd of 6 videos based on content from the book that I plan to make on the topic of ANOVA and related concepts:
See my channel for other videos based on content from the book. In last week's tip, we showed how to state the Null Hypothesis as an equation (e.g. H0: μΑ = μΒ). (HA: μA ≠ μB).  And the Alternative Hypothesis would be the opposite of that:  These work for a 2-tailed (2-sided) test, when we only want to know whether there is a (Statistically Significant) difference between the two Means, not which one may be bigger than the other. But what if we do care about the direction of the difference? This would be a 1-tailed (1-sided) test. And the Alternative Hypothesis will tell us whether it's right-tailed or left-tailed. (We need to specify the tail for our statistical calculator or software.) How does this work? First of all, it's helpful to know that the Alternative Hypothesis is also known as the "Maintained Hypothesis". The Alternative Hypothesis is the Hypothesis which we are maintaining and would like to prove. For example, let's say our school's test scores are 2 points higher than the national average. We would like to prove that this is a Statistically Significant difference. So, we maintain that our school's scores are higher. And we do a t-test to attempt to prove it. Our Alternative Hypothesis is what we maintain: our school's scores are higher. As shown below, the comparison symbol ">" points to the right, so we have a right-tailed test. (For more on the Alternative Hypothesis, you can see my video.) 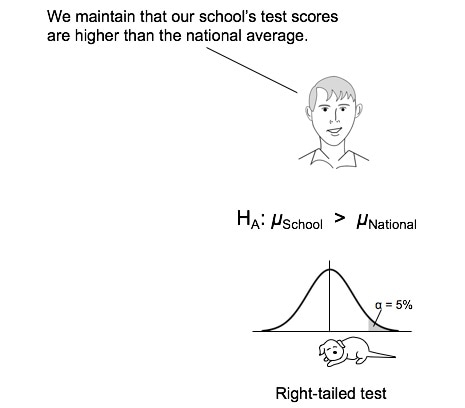 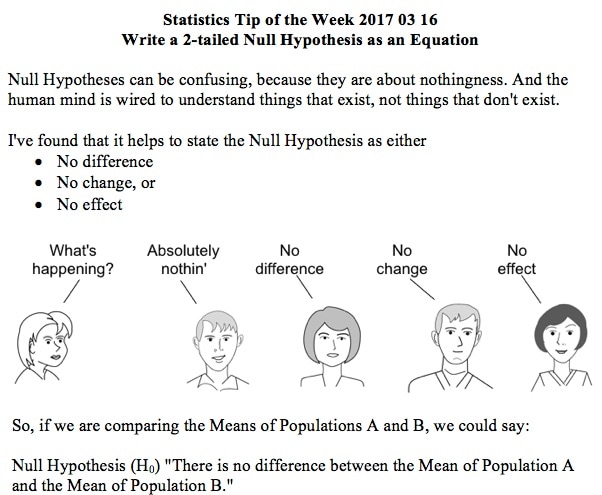 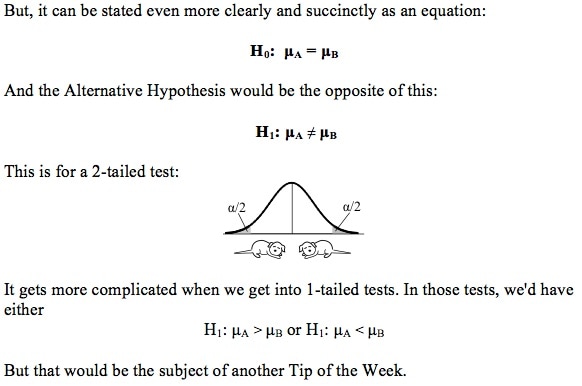 This is the 1st of 6 videos based on content from the book that I plan to make on the topic of ANOVA and related concepts:
 Confusing language and terminology is a big part of what makes statistics confusing. Each Binomial Trial -- also known as a Bernoulli Trial -- is a random experiment with only 2 possible outcomes, called "success" and "failure". The Probability of a "success" (or a "failure") is the same every time the experiment is conducted. A simple example is a coin flip.  A "success" is defined as what we want to count. Let's say we are performing quality control in a manufacturing process. We are counting defects. Every time we find a defect, we add 1 to the count of "successes".
I always found that confusing. So in the book -- instead of saying "success" or "failure" -- I suggest saying "yes" or "no", and count the yesses. I was visiting in Chicago year, when I ran into an old acquaintance -- a psychologist who is a now a partner in a large, successful business consulting practice. I told him I had written a book which was intended to dispel the confusion surrounding statistics.
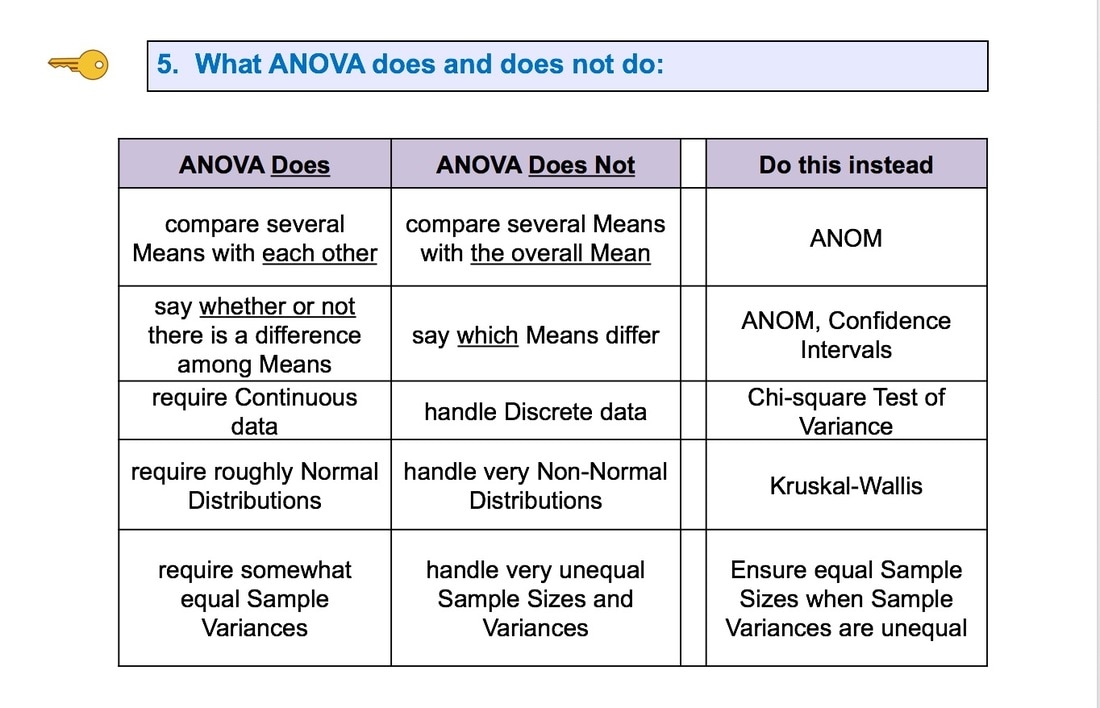
He didn't want to be identified or provide his picture for this blog. But, reminiscing about his graduate student days, he said, "The PhD students were terrified of statistics." Later, after returning home, I ran into another psychologist and I mentioned this to him. He said, "When I was a PhD student I was terrified by statistics. I'm not now, but I was then." So, have heart. statistics confuses almost everyone. 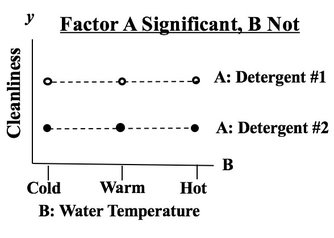 In this example, we are testing 2 Factors for their effect on the y Variable, Cleanliness.
We see from the graph that -- for all three levels of Factor B, Detergent #1 cleans better than Detergent #2. The lines are substantially separated, indicating that the difference is Statistically Significant. (The ANOVA numbers will tell us for sure.) If Factor B did have an effect, the lines would be slanted. Again, separated lines tell us that Factor A has an effect. 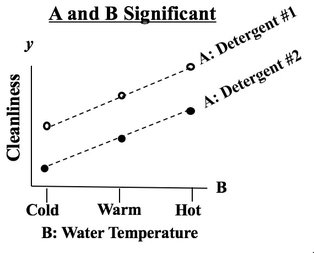 If the lines were not separated, as below, then Factor A does not have an effect. 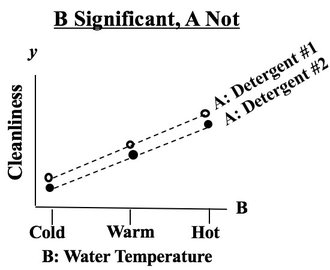 |
AuthorAndrew A. (Andy) Jawlik is the author of the book, Statistics from A to Z -- Confusing Concepts Clarified, published by Wiley. Archives
March 2021
Categories |

 RSS Feed