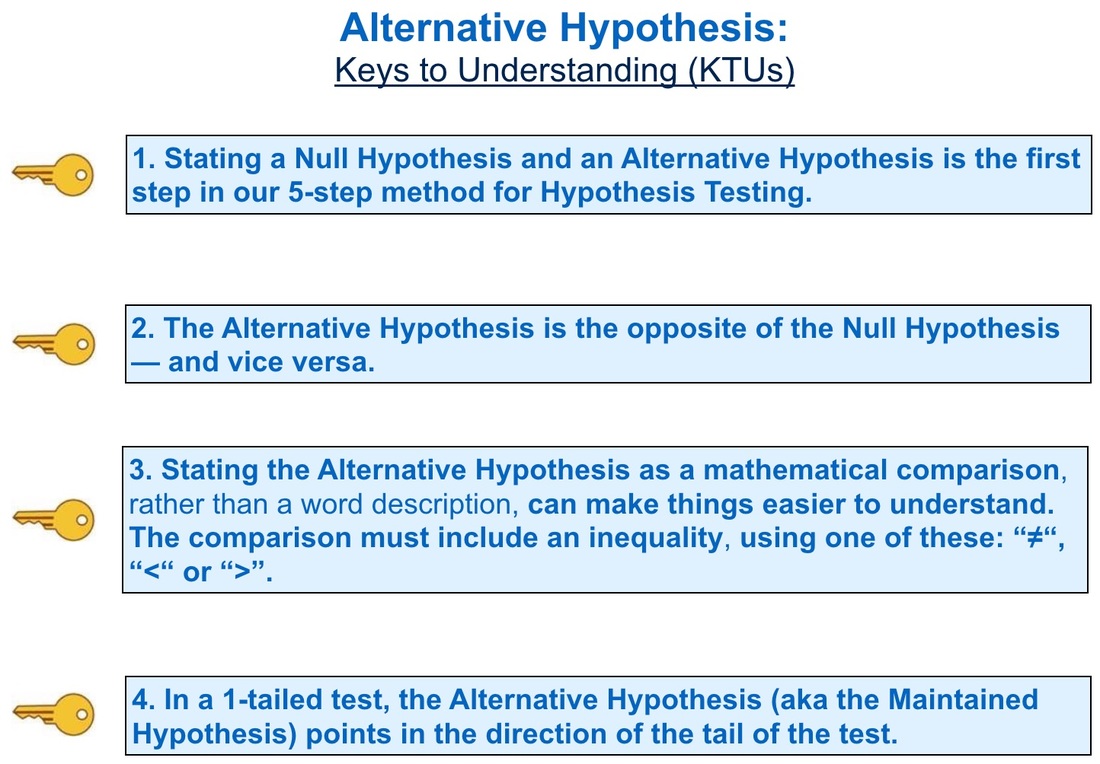
 Last week I uploaded a video on the Null Hypothesis to the YouTube channel. This video on the Alternative Hypothesis, is the 2nd of 5 on the larger concept of Hypothesis Testing. There is some redundancy between these first two, because one can't fully discuss the Null Hypothesis without addressing the Alternative Hypothesis and vice versa. And redundancy and repetition are helpful when you're trying to understand a concept. The Alternative Hypothesis is one of those statistics concepts on which experts disagree. Many include it as part of their recommended approach to Hypothesis Testing. Others are strongly opposed to its use. I think it's very useful for two reasons:
0 Comments
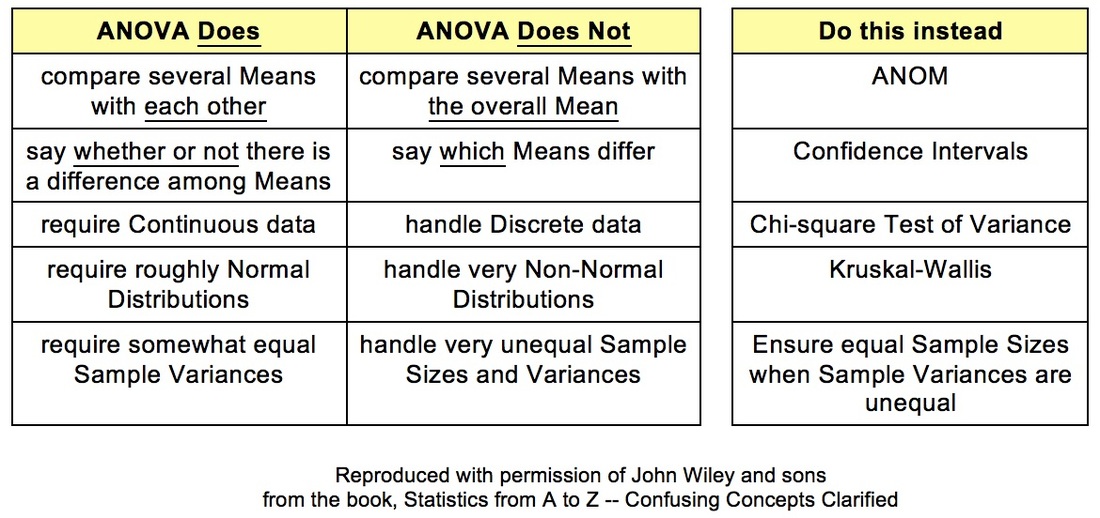
The concept of ANOVA can be confusing in several aspects. To start with, its name is an acronym for "ANalysis Of VAriance", but it is not used for analyzing Variances. (F and Chi-square tests are used for that.) ANOVA is used for analyzing Means. The internal calculations that it uses to do so involve analyzing Variances -- hence the name.
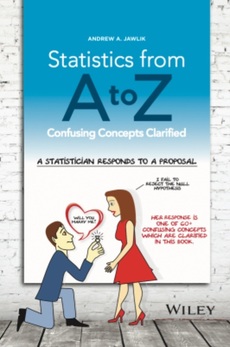
  Thomas Pyzdek is co-author of The Six Sigma Handbook and president of the Pyzdek Institute. He has been using and teaching statistics as part of Six Sigma process improvement methods for decades. Prior to agreeing to publish the book, Statistics from A to Z -- Confusing Concepts Clarified, Wiley asked Mr. Pyzdek to review some excerpts.
He replied, "This book addresses a real need and it seems to do it in a unique and interesting way. I especially like the humor, which should help overcome the sheer terror many people experience with statistics." Note the term "sheer terror". Mr. Pydek teaches the Six Sigma to intelligent technical people, including engineers. And he's not the only one to describe the reaction to statistics as terror -- as we'll see in a future "You are not alone ... " blog post. 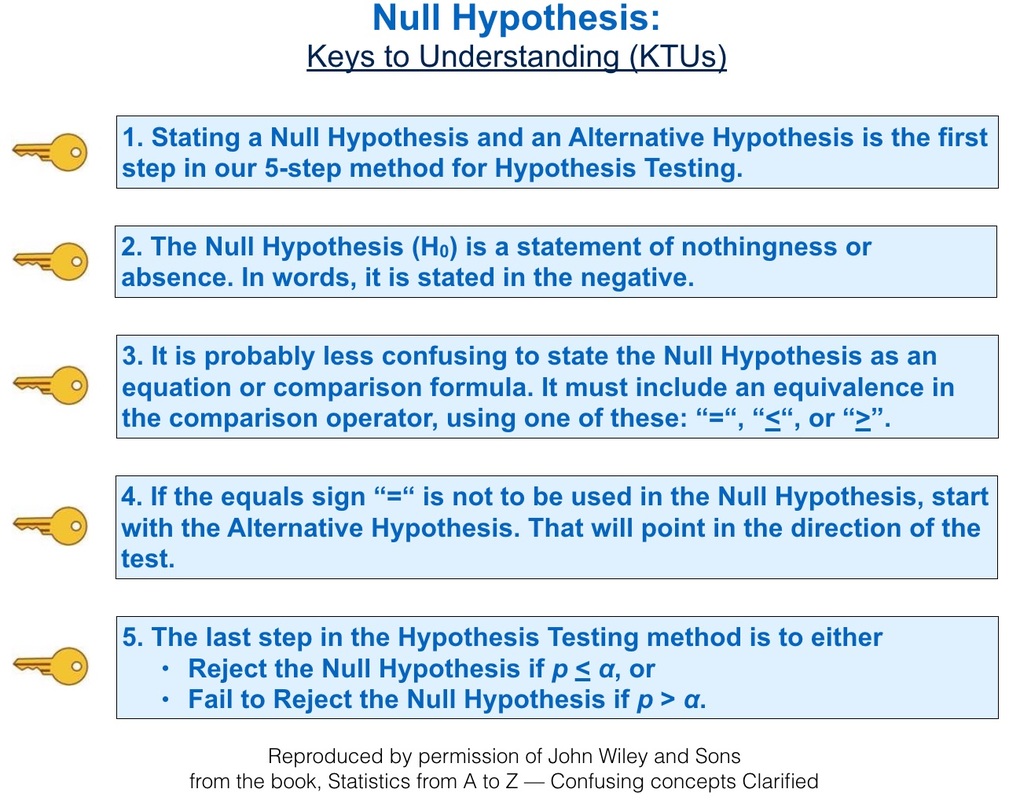 This video, Null Hypothesis, is the first of hopefully many videos based on content from the book, Statistics from A to Z -- Confusing Concepts Clarified. They will be on the YouTube channel which has the same name as the book here's a link http://bit.ly/2dD5H5f. Please subscribe to the channel to be notified when new videos are uploaded. You can also see on the Videos page on this website not only which videos are currently available, but also which are planned to be uploaded next. As you can see from the graphic above, the videos, like the articles in the book, usually start with 4 or 5 Keys to Understanding (KTUs), so that you can see on one page the key things you need to know to understand the concept. The rest of the article or video goes into detailed explanations of each KTU. 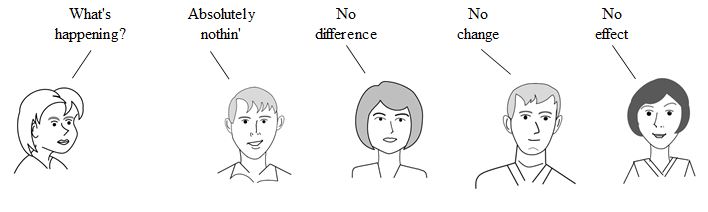 This little cartoon is used in support of KTU #2. I've found it's usually best to try to phrase the Null Hypothesis as either no difference, no change, or no effect.
However, it's even clearer to avoid the use of words completely, as KTU #3 explains.
What makes this book unique:
Videos: There are more than 60 concepts explained in the 75 articles in this book. I plan to make YouTube videos (slideshows with narration) on many or most of them. The first one -- on the Null Hypothesis -- will be uploaded in the next day or two. Please watch this space for the announcement. Videos will be uploaded to my YouTube channel which has the same name as the book. Please subscribe to the channel to be notified of videos when they are uploaded. Also, the Videos page on this website will list available and planned videos. Most users of Statistics are familiar with the F-test for Variances. But there is also a Chi-Square Test for the Variance. What's the difference? 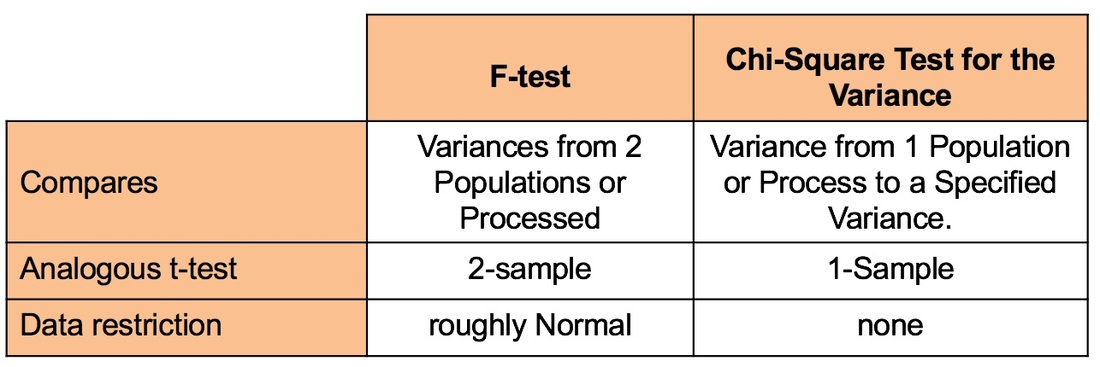 The F-Test compares the Variances from 2 different Populations or Processes. It basically divides one Variance by the other and uses the appropriate F Distribution to determine whether there is a Statistically Significant difference.
If you're familiar with t-tests, the F-test is analogous to the 2-Sample t-test. The F-test is a Parametric test. That is, it requires that the data from both the 2 Samples each be roughly Normal. Chi-Square (like z, t, and F) is a Test Statistic. That is, it has an associated family of Probability Distributions. The Chi-Square Test for the Variance compares the Variance from a Single Population or Process to a Variance that we specify. That could be a target value, a historical value, or anything else. Since there is only 1 Sample of data from the single Population or Process, the Chi-Square test is analogous to the 1-Sample t-test. The Chi-Square test is Nonparametric. It has no restrictions on the data.  from the Upshot column in the New York Times: nyti.ms/2cOi2n4
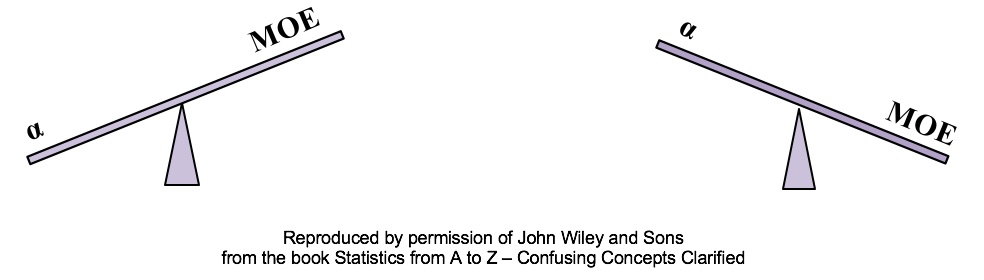 Alpha is the the Significance Level of a statistical test. We select a value for Alpha based on the level of Confidence we want that the test will avoid a False Positive (aka Alpha aka Type I) Error. In the diagrams below, Alpha is split in half and shown as shaded areas under the right and left tails of the Distribution curve. This is for a 2-tailed, aka 2-sided test. 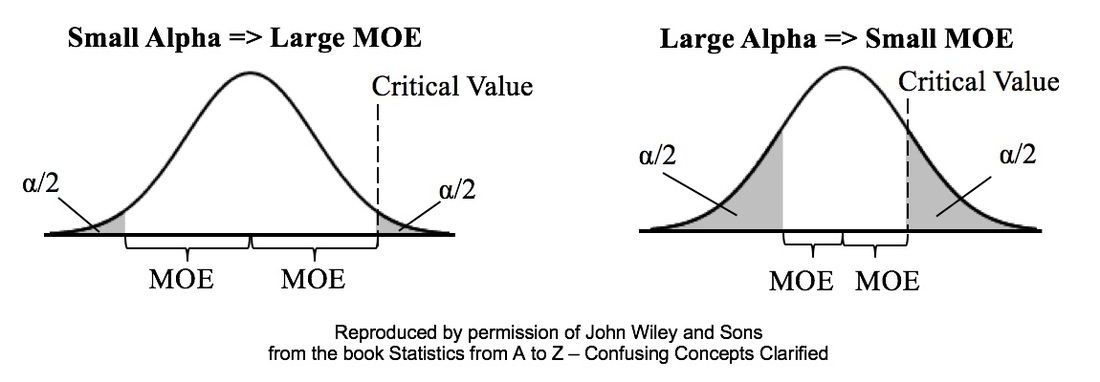 In the left graph above, we have selected the common value of 5% for Alpha. A Critical Value is the point on the horizontal axis where the shaded area ends. The Margin of Error (MOE) is half the distance between the two Critical Values.
A Critical Value is a value on the horizontal axis which forms the boundary of one of the shaded areas. And the Margin of Error is half the distance between the Critical Values. If we want to make Alpha even smaller, the distance between Critical Values would get even larger, resulting in a larger Margin of Error. The right diagram shows that if we want to make the MOE smaller, the price would be larger Alpha. This illustrates the Alpha - MOE see-saw effect. But what if we wanted a smaller MOE without making Alpha larger? Is that possible? It is -- by increasing n, the Sample Size. (It should be noted that, after a certain point, continuing to increase n yields diminishing returns. So, it's not a universal cure for these errors.) 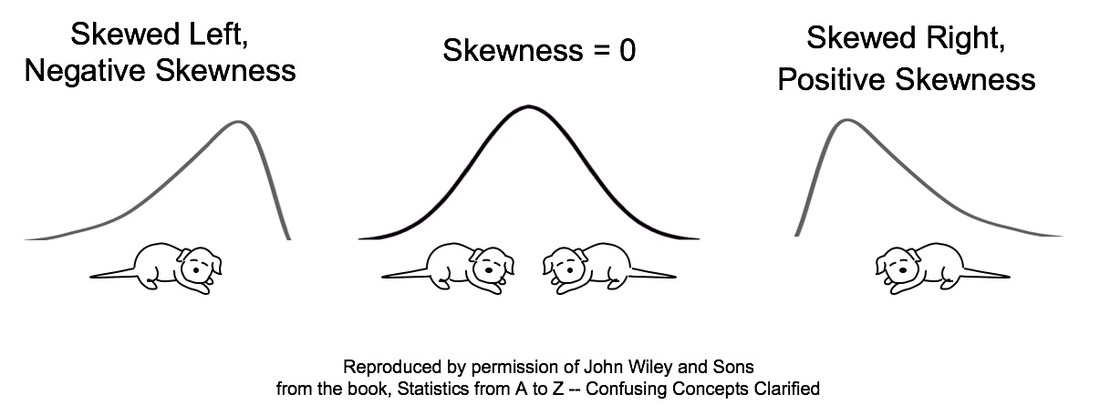 There are 3 categories of numerical properties which describe a Probability Distribution (e.g. the Normal or Binomial Distributions).
Skewness is a case in which common usage of a term is the opposite of statistical usage. If the average person saw the Distribution on the left, they would say that it's skewed to the right, because that is where the bulk of the curve is. However, in statistics, it's the opposite. The Skew is in the direction of the long tail. If you can remember these drawings, think of "the tail wagging the dog." |
AuthorAndrew A. (Andy) Jawlik is the author of the book, Statistics from A to Z -- Confusing Concepts Clarified, published by Wiley. Archives
March 2021
Categories |


 RSS Feed