Statistics Tip of the Week: Always plot the data first; statistics alone can be misleading.3/21/2018 It has been said that the first three laws of statistics are:
Statistics alone can be misleading. The human mind did not evolve to understand concepts by reading words and numbers on a page. It is much more visual. Pictures can help give us an intuitive understanding that words and numbers cannot. Here's an example. We're trying to determine if there is Correlation between the x and y values for either of the two Samples of data pictured below. 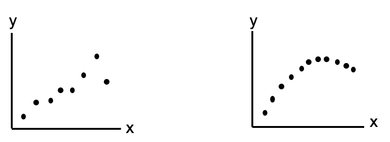 We calculate a Statistic for each Sample, r, the Correlation Coefficient. The value of r for these two plots are almost identical – and in both cases, it indicates a very strong Linear Correlation.
That makes sense for the one on the left. However, the one on the right is not linear at all. That data would more likely to be approximated by a polynomial curve. Our Statistics Tip of the Week for April 6, 2017 explained Common Cause Variation and Special Cause Variation in a process. It also explained how Control Charts and Run Rules could be used to identify Special Causes, which are extraneous causes of Variation that are outside the process. Then -- if needed -- action could be taken to eliminate the Special Causes. This analysis and action -- Statistical Process Control (SPC) -- is an important part of the Six Sigma process improvement discipline. Here is the first of 5 Keys to Understanding in the article in the book about Process Capability Analysis, which is usually the next step after Statistical Process Control. 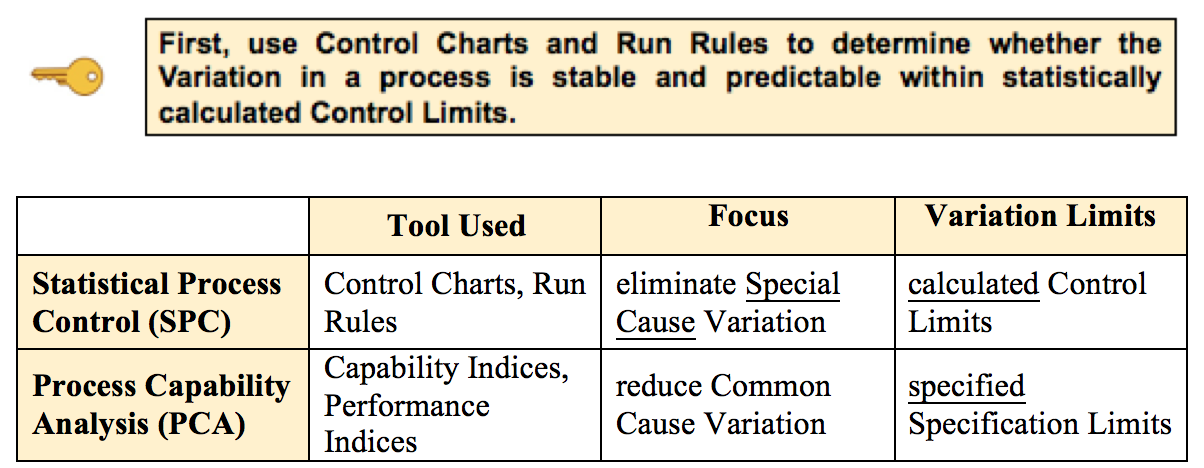 When the Special Causes have been eliminated, we can then take action to improve the process. By improving, we mean reducing Common Cause Variation. That is the Variation that is left once Special Cause Variation has been eliminated.
We measure the process's Capability and Performance before and after possible improvement actions taken, using the tools and techniques of Process Capability Analysis (PCA). More on PCA in a future Tip of the Week. Just uploaded a new video: https://youtu.be/o0o-SWu7kLU  Residuals represent the Error in a Regression Model. They represent the Variation in the y variable which is not explained by the Regression Model. A Residual is the difference between a given y value in the data and the y value predicted by the Model. Residuals must be Random. There are several kinds of non-Randomness to look for. One is unexplained Outliers. And a Box and Whiskers Plot like the one shown below can be used to identify them. 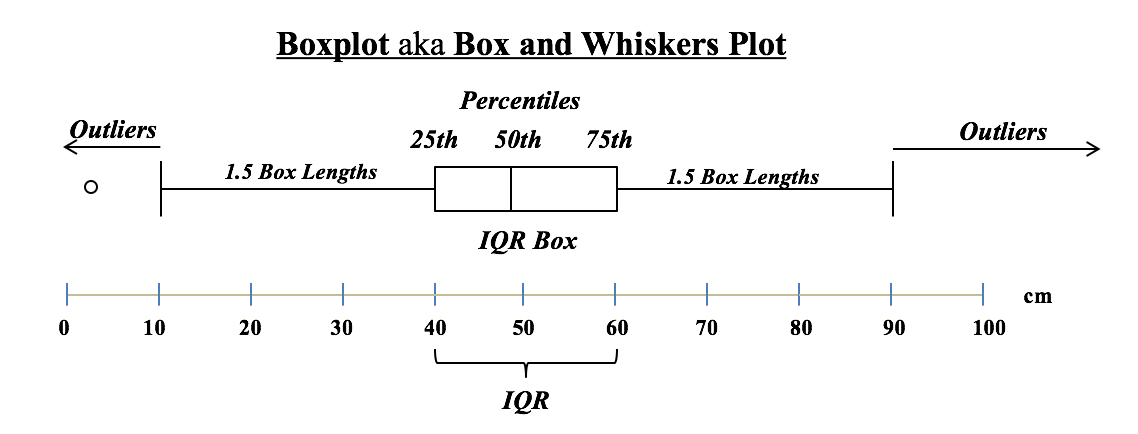 The Interquartile Range (IQR) box shows the Range of the values around the Mean which comprise 50% of the total values. In this example, the IQR is 60 - 40 = 20. Horizontal "whiskers" are drawn to extend 1.5 box-lengths on either side of the box.
Outliers are defined as those Residuals beyond these "whiskers". |
AuthorAndrew A. (Andy) Jawlik is the author of the book, Statistics from A to Z -- Confusing Concepts Clarified, published by Wiley. Archives
March 2021
Categories |

 RSS Feed