STATISTICS FROM A TO Z<br />-- CONFUSING CONCEPTS CLARIFIED
  • Home
    • Why This Book Is Needed
    • Articles List, Additional Concepts
    • Examples: 1-Page Summaries
    • Examples: Concept Flow Diagram
    • Examples: Compare and Contrast Tables
    • Examples: Cartoons
    • Example: Which to Use When Article
  • Buy
  • Blog
  • Sample Articles
  • Videos
  • Author
  • Communicate
  • Files
  • Errata

Statistics Tip of the Week: Always plot the data first; statistics alone can be misleading.

3/21/2018

0 Comments

 
​It has been said that the first three laws of statistics are:
  1. Plot the data.
  2. Plot the data.
  3. Plot the data.
(Some say, 1. Draw a picture, 2 Draw a picture. 3 Draw a picture.)

Statistics alone can be misleading.

The human mind did not evolve to understand concepts by reading words and numbers on a page. It is much more visual. Pictures can help give us an intuitive understanding that words and numbers cannot.
​
Here's an example. We're trying to determine if there is Correlation between the x and y values for either of the two Samples of data pictured below. 
Picture
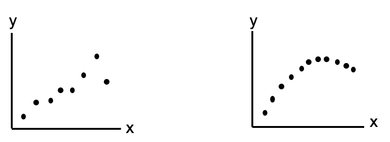
​We calculate a Statistic for each Sample, r, the Correlation Coefficient. The value of r for these two plots are almost identical – and in both cases, it indicates a very strong Linear Correlation.
​
That makes sense for the one on the left. However, the one on the right is not linear at all. That data would more likely to be approximated by a polynomial curve. 
0 Comments


Leave a Reply.

    Author

    Andrew A. (Andy) Jawlik is the author of the book, Statistics from A to Z -- Confusing Concepts Clarified, published by Wiley.

    Archives

    March 2021
    December 2020
    November 2020
    October 2020
    September 2020
    August 2020
    May 2020
    March 2020
    February 2020
    January 2020
    December 2019
    November 2019
    October 2019
    September 2019
    July 2019
    June 2019
    May 2019
    April 2019
    March 2019
    February 2019
    January 2019
    December 2018
    November 2018
    October 2018
    September 2018
    August 2018
    July 2018
    June 2018
    May 2018
    April 2018
    March 2018
    February 2018
    January 2018
    December 2017
    November 2017
    October 2017
    September 2017
    August 2017
    July 2017
    June 2017
    May 2017
    April 2017
    March 2017
    February 2017
    January 2017
    December 2016
    November 2016
    October 2016
    September 2016
    August 2016

    Categories

    All
    New Video
    Stats Tip Of The Week
    You Are Not Alone

    RSS Feed

  • Home
    • Why This Book Is Needed
    • Articles List, Additional Concepts
    • Examples: 1-Page Summaries
    • Examples: Concept Flow Diagram
    • Examples: Compare and Contrast Tables
    • Examples: Cartoons
    • Example: Which to Use When Article
  • Buy
  • Blog
  • Sample Articles
  • Videos
  • Author
  • Communicate
  • Files
  • Errata