Statistics Tip of the Week: Nonparametric Methods can use Signs, Ranks, Signed Ranks, etc.2/24/2018 In our Tip of the Week for 12/14/2017, we said that Nonparametric Methods -- like Wilicoxon, Mann-Whitney, and Kruskal-Wallis -- can work with data that Parametric Methods -- like t-tests and ANOVA -- cannot. Nonparametric methods are often called “distribution-free,” because they are free of any assumptions about the source Distribution(s). They can do this because they convert the data into things like Signs, Ranks, Signed Ranks, and Ranks Sums. Here's how that works: Signs We’ll be comparing Sample data to a value we specify. It could be a target, a historical value, an industry standard, etc. Let’s say that the historical Median time to complete an operation in an industrial process has been 30 seconds. We collect a Sample of 10 time measurements: 28, 31, 30, 33, 32, 28, 30, 31, 27, 32
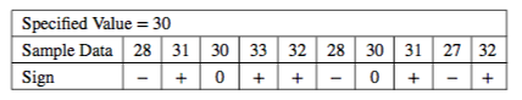
in a Nonparametric method called the Sign Test. Ranks Let’s take that same Sample of data, and order it from low to high. Next, assign a Rank from low to high. For ties, split the difference between the values tied. For example, there are two 28’s. These occupy two Ranks after 1 (a 2 and a 3), so we give them both a 2.5. The next Rank would be a 4, but there’s another tie, so we mark the next two as 4.5’s. 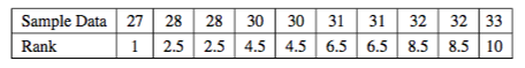 Signed Ranks Signed Ranks, as you might guess, combine the concepts of Signs and Ranks. But there is a change in how Signs are assigned, and one step uses absolute values, so we’ll use a different example with some negative numbers. Let’s say we are doing an analysis of the effect of a training program on employee productivity. If we were doing a Parametric test, we’d use the Paired t-test (aka Dependent Samples t-test.) We count the number of transactions that they process in an hour. For each employee, we subtract their Before Training number from their After Training number. The information we are capturing is the difference. Instead of plus and minus signs, we’ll use +1 and 0. We compare the data values to a specified value, as we did in our example of the historical Median of 30. Each Sample data value is their After production number minus their Before number. We’ll be testing the Null Hypothesis that there is zero difference, so the specified value is zero. Step 1: Sign: For each data value, assign a Sign:
Step 2: Calculate the Absolute Values Step 3: Rank the Absolute Values to produce the Absolute Ranks Step 4: Signed Rank: Multiply the Sign times the Absolute Ranks Signed Rank tests are the NP counterpart to the Dependent Samples (aka Paired Samples) t-test. Rank Sum tests are the NP counterpart of the the Independent Samples (aka 2-Samples) t-test. Since the Rank Sum method will require a somewhat lengthy description and this Tip is getting a bit long., We'll save Rank Sums for another Statistics Tip of the Week.
2 Comments
New video, Sampling Distribution, on the book's YouTube channel. This is also part of the playlist on Probability Distributions. 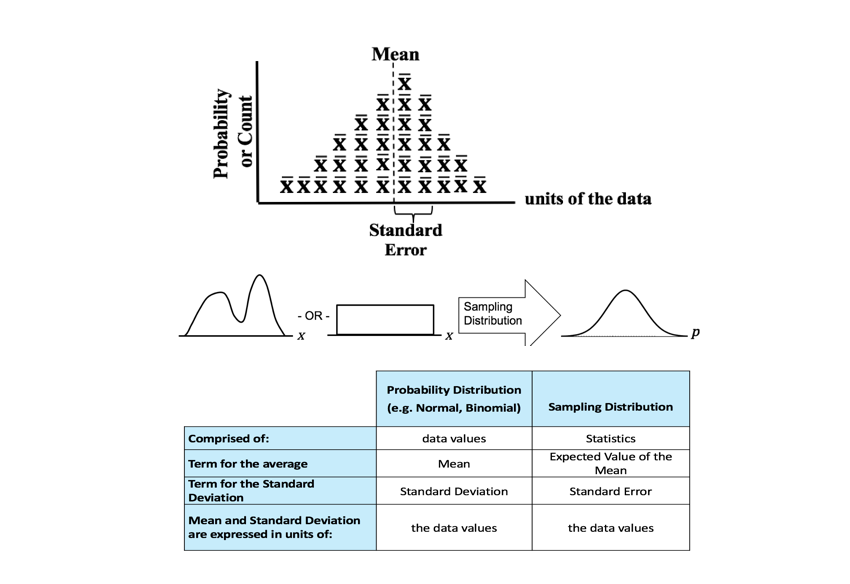 These graphs show the difference between a Distribution that has a Discrete data and a Discrete stairstep Probability graph compared to a Distribution with Continuous data and a Continuous smooth curve.  For the Discrete data Distribution, the values of the Variable X can only be non-negative integers, because they are Counts. There is no Probability shown for 1.5, for example, because 1.5 is not an integer, and so it is not a legitimate value for X. The Probabilities for Discrete data Distribution are shown as separate columns. There is nothing between the columns, because there are no values on the horizontal axis between the individual integers. For Continuous Distributions, values of horizontal-axis Variable are real numbers, and there are an infinite number of them between any two integers. Continuous data are also called Measurement data; examples are length, weight, pressure, etc. The Probabilities for Continuous Distributions are infinitesimal points on smooth curves. 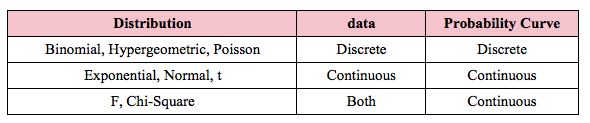 For the first six Distributions described in the table above, the data used to create the values on the horizontal axis come from a single Sample or Population or Process. And the data are either Discrete or Continuous. The F and Chi-Square (𝜒2) Distributions are hybrids. Their horizontal axis Variable is calculated from a ratio of two numbers, and the source data don’t have to be one type or another. Being a ratio, the horizontal axis Variable (F or 𝜒2) is Continuous. The Probability curve is smooth and Continuous.
For more, see my YouTube video Probability Distributions -- Part 1 (of 3): What They Are. There are also videos on the F Distribution and the Chi-Square Distribution. See the Videos page of this website for the latest status of available and planned videos. In our Tip of the Week for Jan 25, 2018, we described Sum of Squares Within (SSW) as a measure of Variation in a group (sample, population or process) of data values. In ANOVA, Sum of Squares Between (SSB) is used together with SSW to determine whether there is a Statistically Significant difference among the Means of several groups. Here's a conceptual illustration of Variation Within and Between groups. Each bell-shaped curve represents a group. The widths of the curves represent how much variation there is within each. That is what SSW represents. 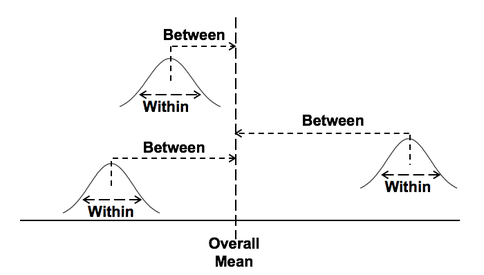 For the variation between Means, we calculate the differences between the Means of each group and the Overall Mean. Then, we square those differences and then we sum those squares. This gives us the Sum of Squares Between, SSB. 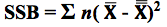 where X-bar is the Mean of an individual group and x-double-bar is the Overall Mean.
ANOVA then calculates a Mean SSB (MSB) and a Mean SSW (MSW). The previous Tip of the Week describes how these are used to calculate the value of the Test Statistic F in the F-test which produces the conclusion from the ANOVA. There is also more on this in my YouTube Video ANOVA-- Part 2, How It Does It. |
AuthorAndrew A. (Andy) Jawlik is the author of the book, Statistics from A to Z -- Confusing Concepts Clarified, published by Wiley. Archives
March 2021
Categories |


 RSS Feed