|
These graphs show the difference between a Distribution that has a Discrete data and a Discrete stairstep Probability graph compared to a Distribution with Continuous data and a Continuous smooth curve.  For the Discrete data Distribution, the values of the Variable X can only be non-negative integers, because they are Counts. There is no Probability shown for 1.5, for example, because 1.5 is not an integer, and so it is not a legitimate value for X. The Probabilities for Discrete data Distribution are shown as separate columns. There is nothing between the columns, because there are no values on the horizontal axis between the individual integers. For Continuous Distributions, values of horizontal-axis Variable are real numbers, and there are an infinite number of them between any two integers. Continuous data are also called Measurement data; examples are length, weight, pressure, etc. The Probabilities for Continuous Distributions are infinitesimal points on smooth curves. 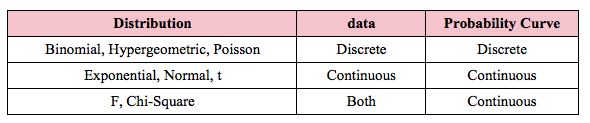 For the first six Distributions described in the table above, the data used to create the values on the horizontal axis come from a single Sample or Population or Process. And the data are either Discrete or Continuous. The F and Chi-Square (𝜒2) Distributions are hybrids. Their horizontal axis Variable is calculated from a ratio of two numbers, and the source data don’t have to be one type or another. Being a ratio, the horizontal axis Variable (F or 𝜒2) is Continuous. The Probability curve is smooth and Continuous.
For more, see my YouTube video Probability Distributions -- Part 1 (of 3): What They Are. There are also videos on the F Distribution and the Chi-Square Distribution. See the Videos page of this website for the latest status of available and planned videos.
0 Comments
Leave a Reply. |
AuthorAndrew A. (Andy) Jawlik is the author of the book, Statistics from A to Z -- Confusing Concepts Clarified, published by Wiley. Archives
March 2021
Categories |

 RSS Feed