|
These are all terms used in Correlation and Linear Regression (Simple and Multiple). And some of these terms have several names. I don't know about you, but I get confused trying to keep them all straight. So I wrote this compare-and-contrast table, which should help. 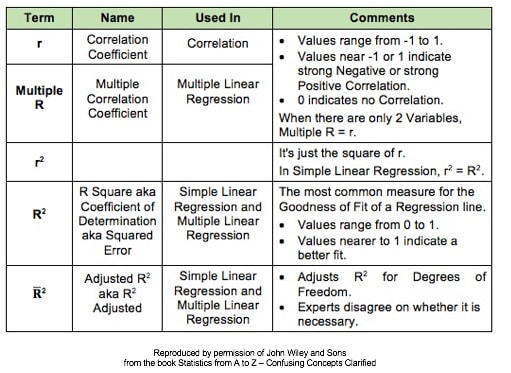
0 Comments
First in a playlist on Statistical Tests. 5 Keys to Understanding and compare-and- contrast tables, help the viewer understand the 3 different types of parametric t-tests. https://youtu.be/ZJlrF_yfiPo. For a complete listing of available and planned videos, please see the Videos page on this website. 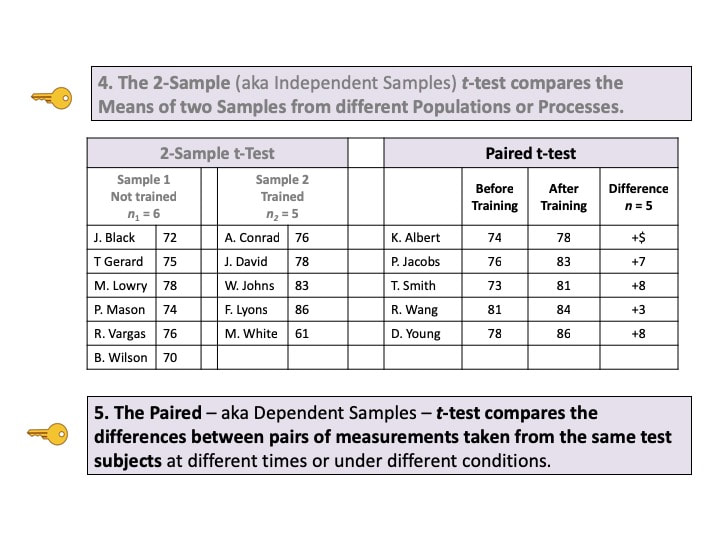 In Regression, we attempt to fit a line or curve to the data. Let's say we're doing Simple Linear Regression in which we are trying to fit a straight line to a set of (x,y) data. We test a number of subjects with dosages from 0 to 3 pills. And we find a straight line relationship, y = 3x, between the number of pills (x) and a measure of health of the subjects. So, we can say this. 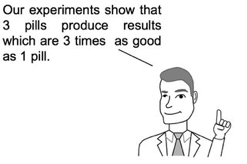 But we cannot make a statement like the following: 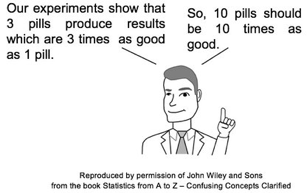 This is called extrapolating the conclusions of your Regression Model beyond the range of the data used to create it. There is no mathematical basis for doing that, and it can have negative consequences, as this little cartoon from my book illustrates. 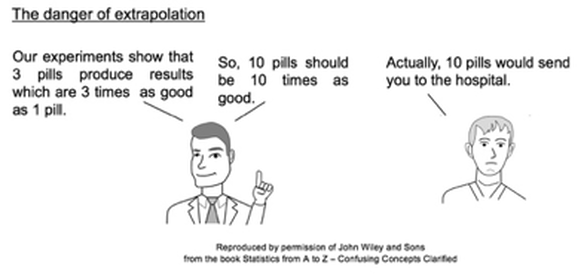 In the graphs below, the dots are data points. In the graph on the left, it is clear that there is a linear correlation between the drug dosage (x) and the health outcome (y) for the range we tested, 0 to 3 pills. And we can interpolate between the measured points. For example, we might reasonably expect that 1.5 pills would yield a health outcome halfway between that of 1 pill and 2 pills. 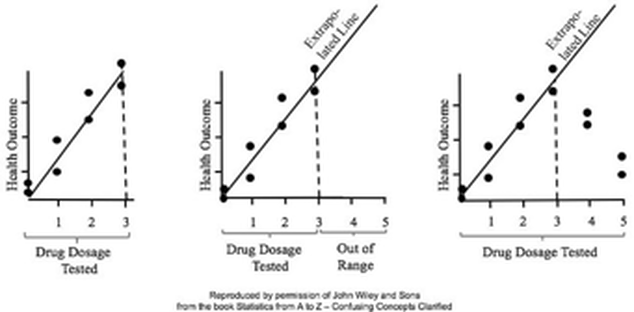 For more on this and other aspects of Regression, you can see the YouTube videos in my playlist on Regression. (See my channel: Statistics from A to Z - Confusing Concepts Clarified.
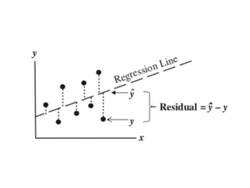 This is the 9th and final video in my channel on Regression. Residuals represent the error in a Regression Model. That is, Residuals represent the Variation in the outcome Variable y, which is not explained by the Regression Model. Residuals must be analyze several ways to ensure that they are random, and that they do no represent the Variation caused by some unidentified x-factor.
See the videos page in this website for a listing of available and planned videos. |
AuthorAndrew A. (Andy) Jawlik is the author of the book, Statistics from A to Z -- Confusing Concepts Clarified, published by Wiley. Archives
March 2021
Categories |

 RSS Feed