|
In Regression, we attempt to fit a line or curve to the data. Let's say we're doing Simple Linear Regression in which we are trying to fit a straight line to a set of (x,y) data. We test a number of subjects with dosages from 0 to 3 pills. And we find a straight line relationship, y = 3x, between the number of pills (x) and a measure of health of the subjects. So, we can say this.  But we cannot make a statement like the following:  This is called extrapolating the conclusions of your Regression Model beyond the range of the data used to create it. There is no mathematical basis for doing that, and it can have negative consequences, as this little cartoon from my book illustrates.  In the graphs below, the dots are data points. In the graph on the left, it is clear that there is a linear correlation between the drug dosage (x) and the health outcome (y) for the range we tested, 0 to 3 pills. And we can interpolate between the measured points. For example, we might reasonably expect that 1.5 pills would yield a health outcome halfway between that of 1 pill and 2 pills. 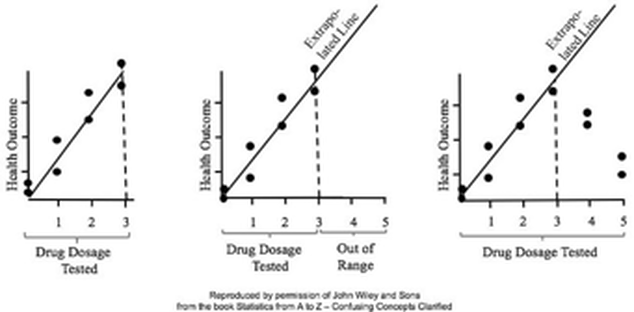 For more on this and other aspects of Regression, you can see the YouTube videos in my playlist on Regression. (See my channel: Statistics from A to Z - Confusing Concepts Clarified.
1 Comment
Jose Maria
1/8/2024 05:37:35 am
I have a very limited set of points obtained in a simulation, thermal radiation intensity of a fire as a function of distance. I adjusted a function like y=A*B^x, A and B constants, y is the intensity and x is the distance. The fit was excellent, however, when I calculate the intensity for points outside the range of the initial data (mainly values smaller than those in the simulation) the results can be absurd. Leave a Reply. |
AuthorAndrew A. (Andy) Jawlik is the author of the book, Statistics from A to Z -- Confusing Concepts Clarified, published by Wiley. Archives
March 2021
Categories |

 RSS Feed