STATISTICS FROM A TO Z<br />-- CONFUSING CONCEPTS CLARIFIED
  • Home
    • Why This Book Is Needed
    • Articles List, Additional Concepts
    • Examples: 1-Page Summaries
    • Examples: Concept Flow Diagram
    • Examples: Compare and Contrast Tables
    • Examples: Cartoons
    • Example: Which to Use When Article
  • Buy
  • Blog
  • Sample Articles
  • Videos
  • Author
  • Communicate
  • Files
  • Errata

Statistics Tip of the Week:  Sum of Squares Between (SSB)

2/6/2018

0 Comments

 
​In our Tip of the Week for Jan 25, 2018, we described Sum of Squares Within (SSW) as a measure of Variation in a group (sample, population or process) of data values. In ANOVA, Sum of Squares Between (SSB) is used together with SSW to determine whether there is a Statistically Significant difference among the Means of several groups.
 
Here's a conceptual illustration of Variation Within and Between groups. Each bell-shaped curve represents a group. The widths of the curves represent how much variation there is within each. That is what SSW represents.
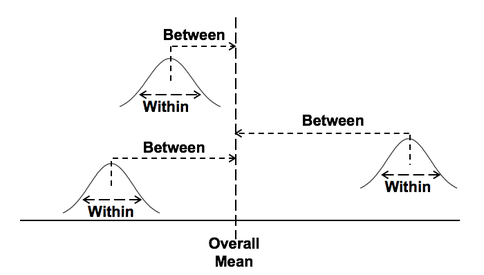
Picture
For the variation between Means, ​we calculate the differences between the Means of each group and the Overall Mean.  Then, we square those differences and then we sum those squares. This gives us the Sum of Squares Between, SSB. 
Picture
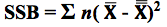
where X-bar is the Mean of an individual group and x-double-bar is the Overall Mean.
 
ANOVA then calculates a Mean SSB (MSB) and a Mean SSW (MSW). The previous Tip of the Week describes how these are used to calculate the value of the Test Statistic F in the F-test which produces the conclusion from the ANOVA.
 
There is also more on this in my YouTube Video ANOVA-- Part 2, How It Does It. 
0 Comments


Leave a Reply.

    Author

    Andrew A. (Andy) Jawlik is the author of the book, Statistics from A to Z -- Confusing Concepts Clarified, published by Wiley.

    Archives

    March 2021
    December 2020
    November 2020
    October 2020
    September 2020
    August 2020
    May 2020
    March 2020
    February 2020
    January 2020
    December 2019
    November 2019
    October 2019
    September 2019
    July 2019
    June 2019
    May 2019
    April 2019
    March 2019
    February 2019
    January 2019
    December 2018
    November 2018
    October 2018
    September 2018
    August 2018
    July 2018
    June 2018
    May 2018
    April 2018
    March 2018
    February 2018
    January 2018
    December 2017
    November 2017
    October 2017
    September 2017
    August 2017
    July 2017
    June 2017
    May 2017
    April 2017
    March 2017
    February 2017
    January 2017
    December 2016
    November 2016
    October 2016
    September 2016
    August 2016

    Categories

    All
    New Video
    Stats Tip Of The Week
    You Are Not Alone

    RSS Feed

  • Home
    • Why This Book Is Needed
    • Articles List, Additional Concepts
    • Examples: 1-Page Summaries
    • Examples: Concept Flow Diagram
    • Examples: Compare and Contrast Tables
    • Examples: Cartoons
    • Example: Which to Use When Article
  • Buy
  • Blog
  • Sample Articles
  • Videos
  • Author
  • Communicate
  • Files
  • Errata