STATISTICS FROM A TO Z<br />-- CONFUSING CONCEPTS CLARIFIED
  • Home
    • Why This Book Is Needed
    • Articles List, Additional Concepts
    • Examples: 1-Page Summaries
    • Examples: Concept Flow Diagram
    • Examples: Compare and Contrast Tables
    • Examples: Cartoons
    • Example: Which to Use When Article
  • Buy
  • Blog
  • Sample Articles
  • Videos
  • Author
  • Communicate
  • Files
  • Errata

Statistics Tip of the Week: Use a Box and Whiskers Plot to identify Outlier Residuals in your Regression Model

3/7/2018

0 Comments

 
Residuals represent the Error in a Regression Model. They represent the Variation in the y variable which is not explained by the Regression Model. A Residual is the difference between a given y value in the data and the y value predicted by the Model.

Residuals must be Random. There are several kinds of non-Randomness to look for. One is unexplained Outliers. And a Box and Whiskers Plot like the one shown below can be used to identify them.
Picture
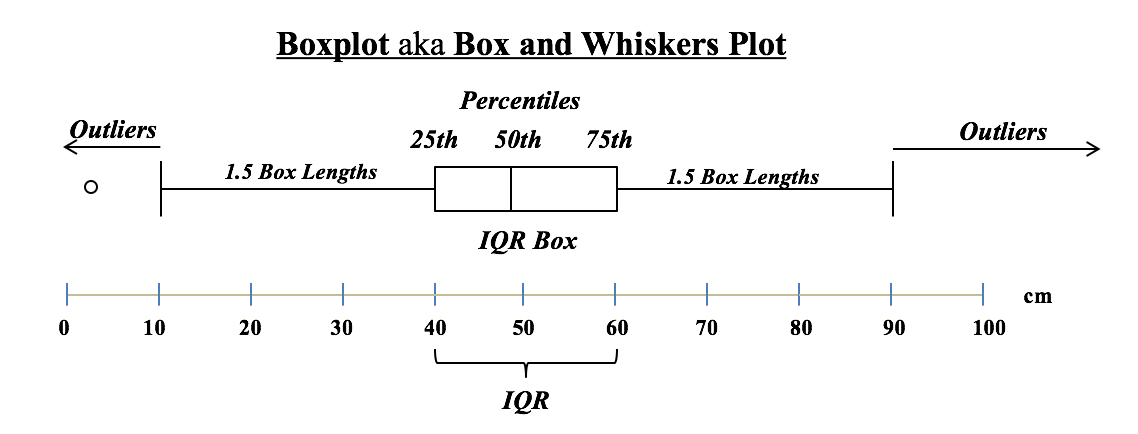
The Interquartile Range (IQR) box shows the Range of the values around the Mean which comprise 50% of the total values. In this example, the IQR is 60 - 40 = 20. Horizontal "whiskers" are drawn to extend 1.5 box-lengths on either side of the box. 

Outliers are defined as those Residuals beyond these "whiskers". 
0 Comments


Leave a Reply.

    Author

    Andrew A. (Andy) Jawlik is the author of the book, Statistics from A to Z -- Confusing Concepts Clarified, published by Wiley.

    Archives

    March 2021
    December 2020
    November 2020
    October 2020
    September 2020
    August 2020
    May 2020
    March 2020
    February 2020
    January 2020
    December 2019
    November 2019
    October 2019
    September 2019
    July 2019
    June 2019
    May 2019
    April 2019
    March 2019
    February 2019
    January 2019
    December 2018
    November 2018
    October 2018
    September 2018
    August 2018
    July 2018
    June 2018
    May 2018
    April 2018
    March 2018
    February 2018
    January 2018
    December 2017
    November 2017
    October 2017
    September 2017
    August 2017
    July 2017
    June 2017
    May 2017
    April 2017
    March 2017
    February 2017
    January 2017
    December 2016
    November 2016
    October 2016
    September 2016
    August 2016

    Categories

    All
    New Video
    Stats Tip Of The Week
    You Are Not Alone

    RSS Feed

  • Home
    • Why This Book Is Needed
    • Articles List, Additional Concepts
    • Examples: 1-Page Summaries
    • Examples: Concept Flow Diagram
    • Examples: Compare and Contrast Tables
    • Examples: Cartoons
    • Example: Which to Use When Article
  • Buy
  • Blog
  • Sample Articles
  • Videos
  • Author
  • Communicate
  • Files
  • Errata