STATISTICS FROM A TO Z<br />-- CONFUSING CONCEPTS CLARIFIED
  • Home
    • Why This Book Is Needed
    • Articles List, Additional Concepts
    • Examples: 1-Page Summaries
    • Examples: Concept Flow Diagram
    • Examples: Compare and Contrast Tables
    • Examples: Cartoons
    • Example: Which to Use When Article
  • Buy
  • Blog
  • Sample Articles
  • Videos
  • Author
  • Communicate
  • Files
  • Errata

Statistics Tip: Statistics See-saws: Test Statistic and p-value

1/29/2020

0 Comments

 
Picture
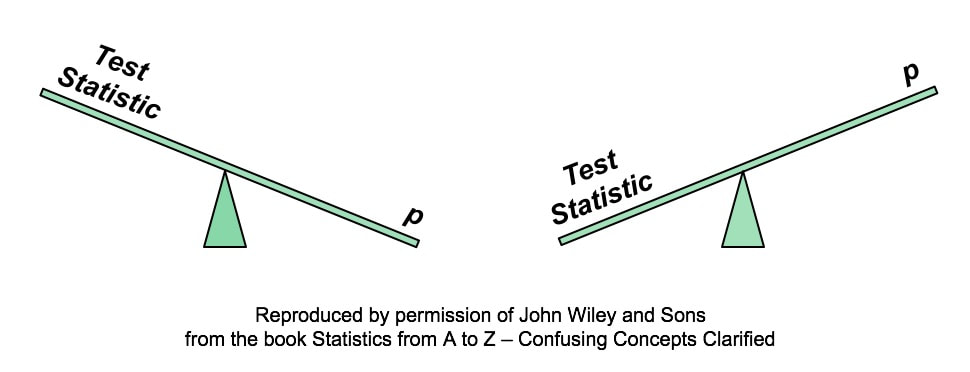
A larger Test Statistic value (such as that for z, t, F, or Chi-Square) results in a smaller p-value. The p-value is the Probability of an Alpha (False Positive) Error.
 
​And conversely, a smaller Test Statistic value results in a larger value for p.
 
Here's how it works:
  • A value of the Test Statistic, say t, is calculated from the Sample data.
  • That value is plotted on the horizontal axis of the Distribution of the Test Statistic.
  • p is then calculated as the area under the curve bounded by the Test Statistic value. It is shown as the hatched area in the diagrams below.
Picture
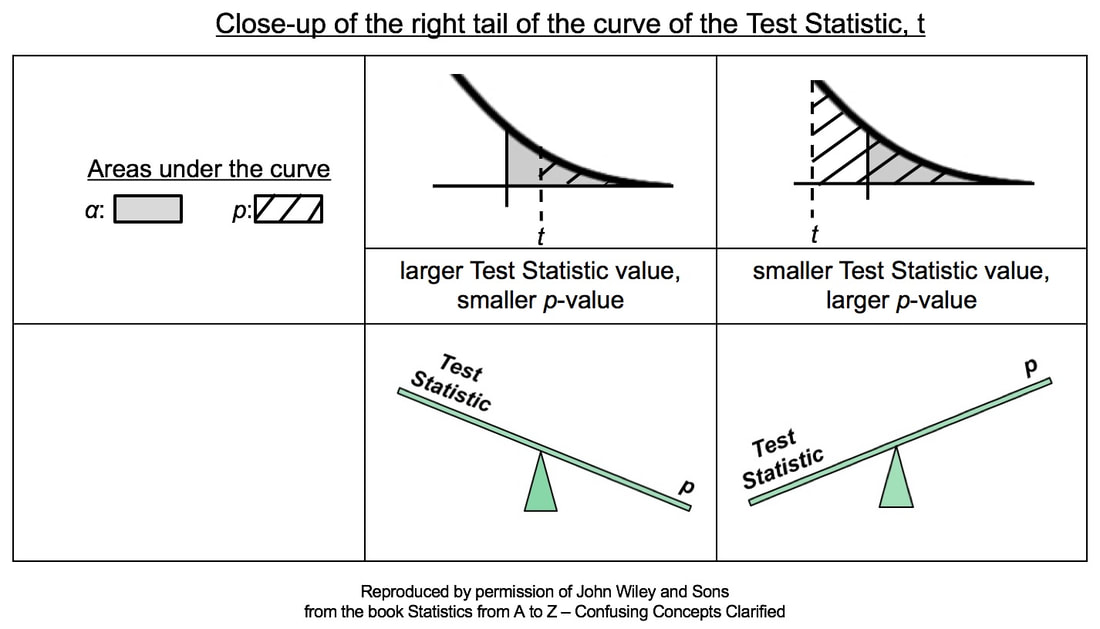
​In the close-ups of the right tail, zero is not visible. It is the center of the bell-shaped t curve, and it is out of the picture to the left. So, a larger value of the Test Statistic, t, would be farther to the right. And, the hatched area under the curve representing the p-value would be smaller. This is illustrated in the middle column of the table above.
 
Conversely, if the Test Statistic is smaller, then it's value is plotted more to the left, closer to zero. And so, the hatched area under the curve representing p would be larger. This is shown in the rightmost column of the table.
0 Comments


Leave a Reply.

    Author

    Andrew A. (Andy) Jawlik is the author of the book, Statistics from A to Z -- Confusing Concepts Clarified, published by Wiley.

    Archives

    December 2020
    November 2020
    October 2020
    September 2020
    August 2020
    May 2020
    March 2020
    February 2020
    January 2020
    December 2019
    November 2019
    October 2019
    September 2019
    July 2019
    June 2019
    May 2019
    April 2019
    March 2019
    February 2019
    January 2019
    December 2018
    November 2018
    October 2018
    September 2018
    August 2018
    July 2018
    June 2018
    May 2018
    April 2018
    March 2018
    February 2018
    January 2018
    December 2017
    November 2017
    October 2017
    September 2017
    August 2017
    July 2017
    June 2017
    May 2017
    April 2017
    March 2017
    February 2017
    January 2017
    December 2016
    November 2016
    October 2016
    September 2016
    August 2016

    Categories

    All
    New Video
    Stats Tip Of The Week
    You Are Not Alone

    RSS Feed

  • Home
    • Why This Book Is Needed
    • Articles List, Additional Concepts
    • Examples: 1-Page Summaries
    • Examples: Concept Flow Diagram
    • Examples: Compare and Contrast Tables
    • Examples: Cartoons
    • Example: Which to Use When Article
  • Buy
  • Blog
  • Sample Articles
  • Videos
  • Author
  • Communicate
  • Files
  • Errata