STATISTICS FROM A TO Z<br />-- CONFUSING CONCEPTS CLARIFIED
  • Home
    • Why This Book Is Needed
    • Articles List, Additional Concepts
    • Examples: 1-Page Summaries
    • Examples: Concept Flow Diagram
    • Examples: Compare and Contrast Tables
    • Examples: Cartoons
    • Example: Which to Use When Article
  • Buy
  • Blog
  • Sample Articles
  • Videos
  • Author
  • Communicate
  • Files
  • Errata

Statistics Tip of the Week: Designed Experiments provide strong evidence of cause and effect.

5/25/2017

0 Comments

 
 For a Process output, y, which is a function of several Factors (x's), that is, for
Picture
the Design of Experiments (DOE) discipline can design the most efficient and 
effective experiments to determine the values of the x's which produce the optimal value for -- or the minimal Variation in -- the Response Variable, y.
 
DOE is active and controlling. (This can be done with Processes, but usually not with Populations).
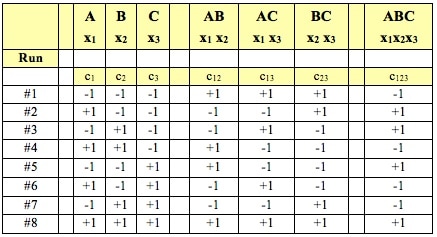
 DOE doesn’t collect or measure existing data with pre-existing values for y and the x’s. DOE specifies Combinations of values for inputs (Factors) and then measures the resulting values of the outputs (Responses). This is the Design of the Experiment.
​

Statistical software packages perform DOE calculations which specify the elements which make up the Design:
  • Levels (e.g., high and low values) of the x Variables
  • Combinations of variables and values
  • Replications
  • Order
Designed Experiments (those designed by DOE) provide much stronger evidence of Cause and Effect than Inferential Statistics. If a Regression Model is to be a valid model of Cause and Effect, it must be able to predict future data derived from controlled experiments. Experiments designed by DOE are a good way to test this. 
Picture
0 Comments


Leave a Reply.

    Author

    Andrew A. (Andy) Jawlik is the author of the book, Statistics from A to Z -- Confusing Concepts Clarified, published by Wiley.

    Archives

    December 2020
    November 2020
    October 2020
    September 2020
    August 2020
    May 2020
    March 2020
    February 2020
    January 2020
    December 2019
    November 2019
    October 2019
    September 2019
    July 2019
    June 2019
    May 2019
    April 2019
    March 2019
    February 2019
    January 2019
    December 2018
    November 2018
    October 2018
    September 2018
    August 2018
    July 2018
    June 2018
    May 2018
    April 2018
    March 2018
    February 2018
    January 2018
    December 2017
    November 2017
    October 2017
    September 2017
    August 2017
    July 2017
    June 2017
    May 2017
    April 2017
    March 2017
    February 2017
    January 2017
    December 2016
    November 2016
    October 2016
    September 2016
    August 2016

    Categories

    All
    New Video
    Stats Tip Of The Week
    You Are Not Alone

    RSS Feed

  • Home
    • Why This Book Is Needed
    • Articles List, Additional Concepts
    • Examples: 1-Page Summaries
    • Examples: Concept Flow Diagram
    • Examples: Compare and Contrast Tables
    • Examples: Cartoons
    • Example: Which to Use When Article
  • Buy
  • Blog
  • Sample Articles
  • Videos
  • Author
  • Communicate
  • Files
  • Errata