STATISTICS FROM A TO Z<br />-- CONFUSING CONCEPTS CLARIFIED
  • Home
    • Why This Book Is Needed
    • Articles List, Additional Concepts
    • Examples: 1-Page Summaries
    • Examples: Concept Flow Diagram
    • Examples: Compare and Contrast Tables
    • Examples: Cartoons
    • Example: Which to Use When Article
  • Buy
  • Blog
  • Sample Articles
  • Videos
  • Author
  • Communicate
  • Files
  • Errata

Statistics Tip of the Week: In Simple Nonlinear Regression, use a polynomial  if the curve changes direction.

5/17/2017

0 Comments

 
Picture
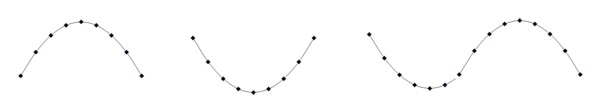
The "Simple" in "Simple Nonlinear" means that there is only one x Variable in the formula  of the formula e.g. y = f(x). The "nonlinear" means that we have determined that a straight line will not fit the data. We need to use some kind of curve -- e.g. Exponential, Logarithmic, Power, Polynomial, or some other type.
A Polynomial has a formula
Picture
Note that there is just one x Variable, but it is raised to various powers, starting with the power of 2. (If there were only a power of 1, the equation would be that of a straight line.)  The b's are Coefficients and the a is an Intercept.
​
A "2nd degree", also known as "2nd order" or "Quadratic", Polynomial is of the form:
Picture
Picture
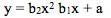
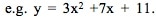
A 2nd order Polynomial has 1 change in direction. As x increases, y increases and then decreases (or y decreases and then increases). Two examples are pictured above. These shapes are Parabolas.

A "3rd degree", aka "3rd order" aka Cubic" Polynomial has an x cubed term and changes direction twice.

A kth degree Polynomial has k – 1 changes in direction.

Simpler is better. It is usually not necessary to go beyond 3 orders. Larger orders are harder to work with. Also, they may be too closely associated with the idiosyncracies of the data provided in a particular Sample, and they may not be generally applicable to  data in other Samples from the same Population or Process. 
Reproduced by permission of John Wiley and Sons, Inc
from the book, Statistics from A to Z -- Confusing Concepts Clarified
0 Comments


Leave a Reply.

    Author

    Andrew A. (Andy) Jawlik is the author of the book, Statistics from A to Z -- Confusing Concepts Clarified, published by Wiley.

    Archives

    March 2021
    December 2020
    November 2020
    October 2020
    September 2020
    August 2020
    May 2020
    March 2020
    February 2020
    January 2020
    December 2019
    November 2019
    October 2019
    September 2019
    July 2019
    June 2019
    May 2019
    April 2019
    March 2019
    February 2019
    January 2019
    December 2018
    November 2018
    October 2018
    September 2018
    August 2018
    July 2018
    June 2018
    May 2018
    April 2018
    March 2018
    February 2018
    January 2018
    December 2017
    November 2017
    October 2017
    September 2017
    August 2017
    July 2017
    June 2017
    May 2017
    April 2017
    March 2017
    February 2017
    January 2017
    December 2016
    November 2016
    October 2016
    September 2016
    August 2016

    Categories

    All
    New Video
    Stats Tip Of The Week
    You Are Not Alone

    RSS Feed

  • Home
    • Why This Book Is Needed
    • Articles List, Additional Concepts
    • Examples: 1-Page Summaries
    • Examples: Concept Flow Diagram
    • Examples: Compare and Contrast Tables
    • Examples: Cartoons
    • Example: Which to Use When Article
  • Buy
  • Blog
  • Sample Articles
  • Videos
  • Author
  • Communicate
  • Files
  • Errata