|
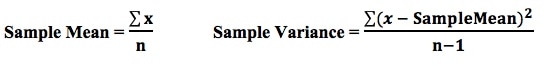
A Statistic is a numerical property of a Sample, for example, the Sample Mean or Sample Variance. A Statistic is an estimate of the corresponding property (“Parameter”) in the Population or Process from which the Sample was drawn. Being an estimate, it will likely not have the exact same value as its corresponding population Parameter. The difference is the error in the estimation. So, if we calculate a Statistic entirely from data values, there is a certain amount of error. For example, the Sample Mean is calculated entirely from the values of the Sample data. It is the sum of all the data values in the Sample divided by the number, n, of items in the Sample. There is one source of error in its formula – the fact that it is an estimate because it does not use all the data in the Population or Process. 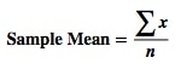 If we then use that Statistic to calculate another Statistic, it brings its own estimation error into the calculation of the second Statistic. This error is in addition to the second Statistic’s estimation error. This happens in the case of the Sample Variance. The numerator of the formula for Sample Variance includes the Sample Mean. It takes each data value (the x’s) in the Sample and subtracts from it the Sample Mean, squares it. Then it sums all those subtracted values. So, the Sample Variance has two sources of error:
 That is why the Degrees of Freedom for the Chi Square Test for the Variance is n - 1. Subtracting 1 from the n in the denominator results in a larger value for the Variance. This addresses the two sources of error. Here are the formulas for Degrees of Freedom for some Statistics and tests: 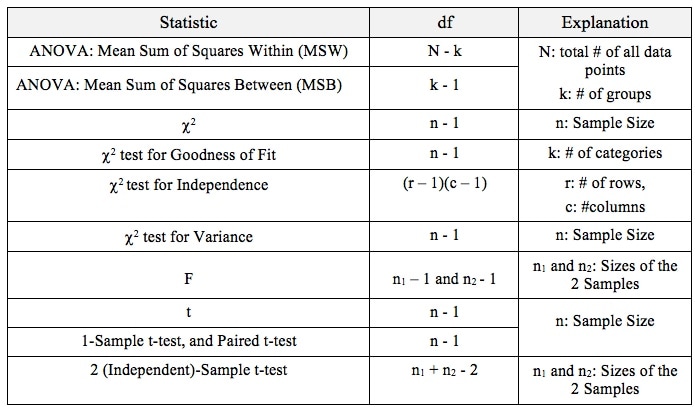
3 Comments
Indrajeet DILIPSINH
7/17/2018 09:57:18 am
Nice knowledge Great explanation of the concept of degrees of freedom and how they vary depending on the statistic and the test used. It's interesting to see how the estimation error can affect multiple statistics and lead to a larger variance. Can you provide an example of a real-world situation where understanding degrees of freedom and estimation error is important in statistical analysis? Leave a Reply. |
AuthorAndrew A. (Andy) Jawlik is the author of the book, Statistics from A to Z -- Confusing Concepts Clarified, published by Wiley. Archives
March 2021
Categories |

 RSS Feed