|
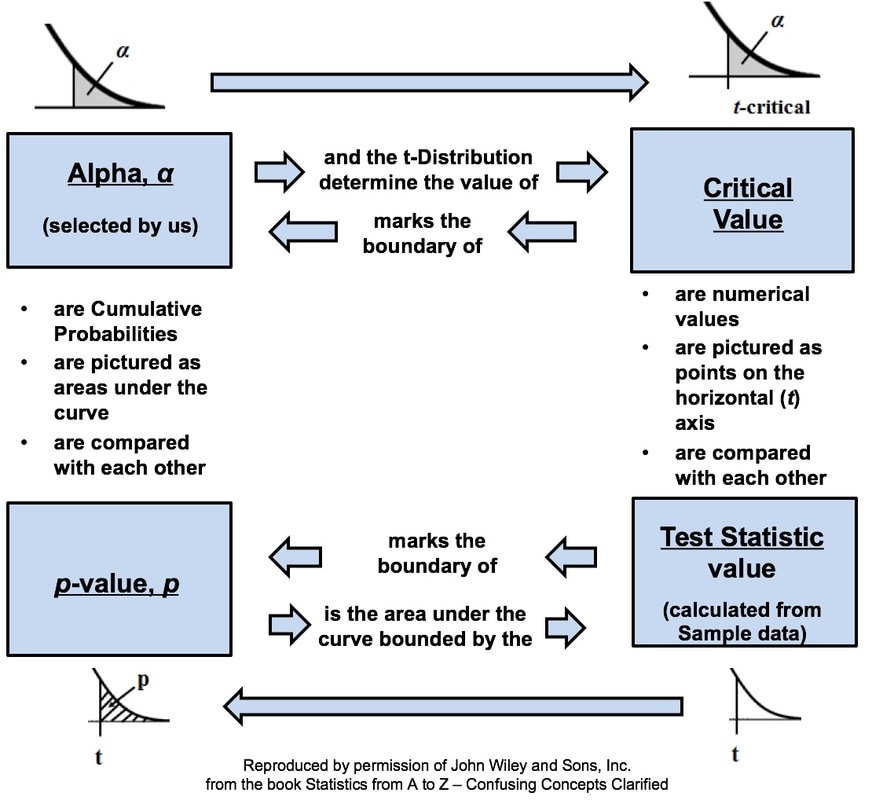
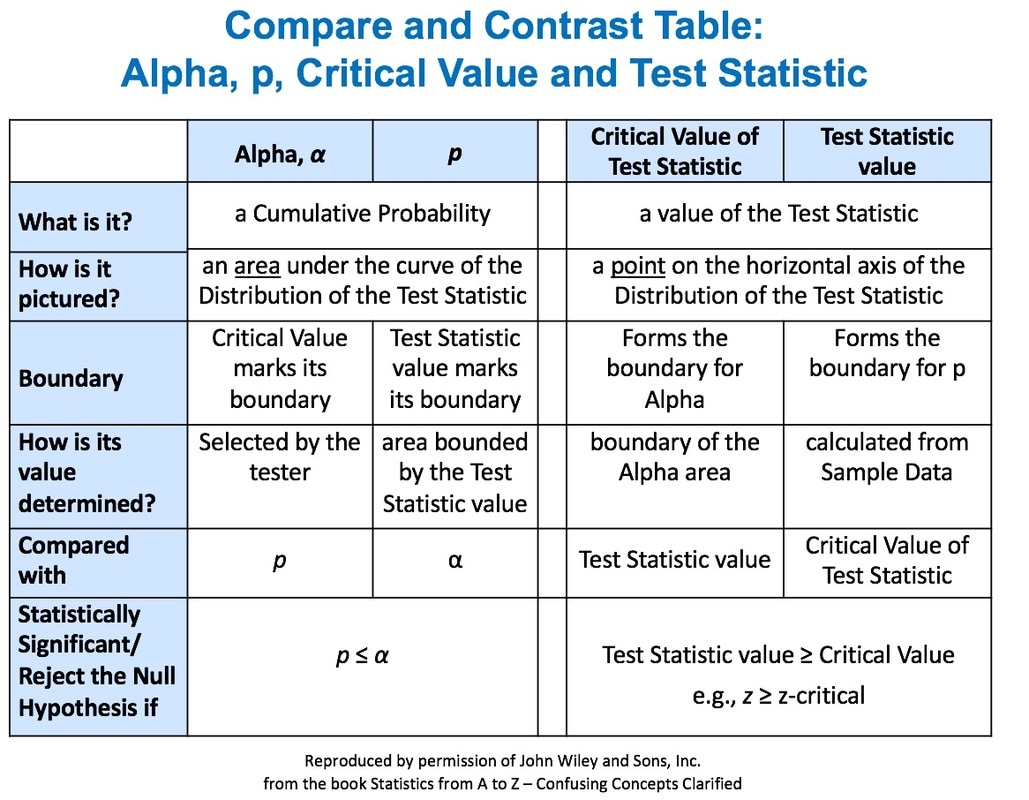
This is the 5th of 5 Videos in the playlist "Central Concepts in Inferential Statistics". It visually explains how these 4 concepts at the heart of Inferential Statistics interrelate and work together. This is something that is sorely lacking in other books, websites, and videos that I have seen. There, individual concepts are too often explained in isolation, without showing them in the context of how they work with other concepts. Two different types of graphics are provided in the article in my book and in this video. In each case, they are deconstructed into sections and explained as they are built up. Link to Video Link to Channel Here is how the story is pictured with a Concept Flow Diagram: And, here is how it is shown as a Compare and Contrast Table:
0 Comments
Leave a Reply. |
AuthorAndrew A. (Andy) Jawlik is the author of the book, Statistics from A to Z -- Confusing Concepts Clarified, published by Wiley. Archives
March 2021
Categories |


 RSS Feed