STATISTICS FROM A TO Z<br />-- CONFUSING CONCEPTS CLARIFIED
  • Home
    • Why This Book Is Needed
    • Articles List, Additional Concepts
    • Examples: 1-Page Summaries
    • Examples: Concept Flow Diagram
    • Examples: Compare and Contrast Tables
    • Examples: Cartoons
    • Example: Which to Use When Article
  • Buy
  • Blog
  • Sample Articles
  • Videos
  • Author
  • Communicate
  • Files
  • Errata

Statistics Tip of the Week: Acceptance and Rejection Regions

9/20/2017

0 Comments

 
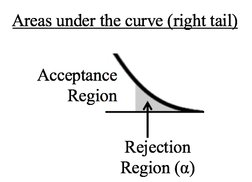
Hypothesis Testing is confusing for many, if not most, people. The graphical concepts of Acceptance and Rejection Regions may help clarify the confusion.
Picture
Let's say we are performing a t-test and that the test is 1-tailed. The person performing the test selects a value for Alpha, the Significance Level. Most often, 5% is selected. This illustration shows a close-up of the right tail of a t-Distribution. Alpha is plotted as the shaded area under the curve of the right tail. 
​Sample data is collected and the t-test is run.  The test calculates a value for p. Like Alpha, p is a Cumulative Probability shown as an area under the curve of the t-Distribution. 
 
The illustration below shows the two possible results. Here, we show p as a hatched area and Alpha as a shaded area. The middle diagram shows the result in which p is calculated to be less than or equal to Alpha.  In that case, the hatched area representing p fits entirely within the shaded Rejection Region which represents Alpha. So, the conclusion of the test is to Reject the Null Hypothesis.
Picture
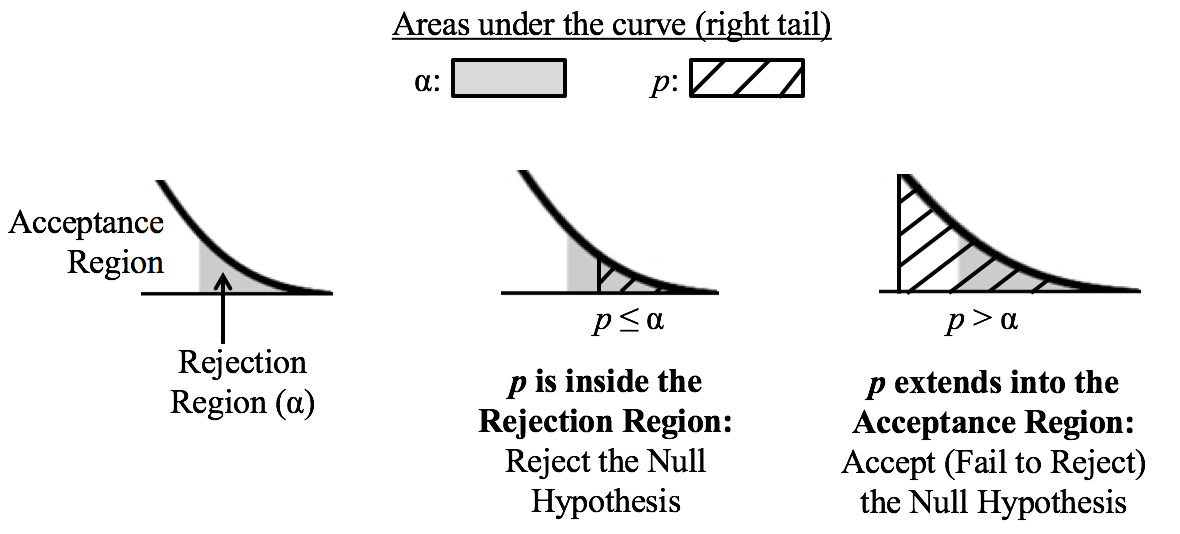
​The right diagram shows the case in which p is larger than Alpha. The hatched area representing p is larger than the shaded Rejection Region, and it extends into the unshaded Acceptance Region. So, the conclusion of the test is to Accept -- that is, Fail to Reject -- the Null Hypothesis.

If you would like more information on Alpha, p, Null Hypothesis, Fail to Reject, and other concepts in Hypothesis Testing, there are individual videos on each concept in my YouTube channel, which has the same name as the book: "Statistics from A to Z -- Confusing Concepts Clarified."
0 Comments


Leave a Reply.

    Author

    Andrew A. (Andy) Jawlik is the author of the book, Statistics from A to Z -- Confusing Concepts Clarified, published by Wiley.

    Archives

    December 2020
    November 2020
    October 2020
    September 2020
    August 2020
    May 2020
    March 2020
    February 2020
    January 2020
    December 2019
    November 2019
    October 2019
    September 2019
    July 2019
    June 2019
    May 2019
    April 2019
    March 2019
    February 2019
    January 2019
    December 2018
    November 2018
    October 2018
    September 2018
    August 2018
    July 2018
    June 2018
    May 2018
    April 2018
    March 2018
    February 2018
    January 2018
    December 2017
    November 2017
    October 2017
    September 2017
    August 2017
    July 2017
    June 2017
    May 2017
    April 2017
    March 2017
    February 2017
    January 2017
    December 2016
    November 2016
    October 2016
    September 2016
    August 2016

    Categories

    All
    New Video
    Stats Tip Of The Week
    You Are Not Alone

    RSS Feed

  • Home
    • Why This Book Is Needed
    • Articles List, Additional Concepts
    • Examples: 1-Page Summaries
    • Examples: Concept Flow Diagram
    • Examples: Compare and Contrast Tables
    • Examples: Cartoons
    • Example: Which to Use When Article
  • Buy
  • Blog
  • Sample Articles
  • Videos
  • Author
  • Communicate
  • Files
  • Errata