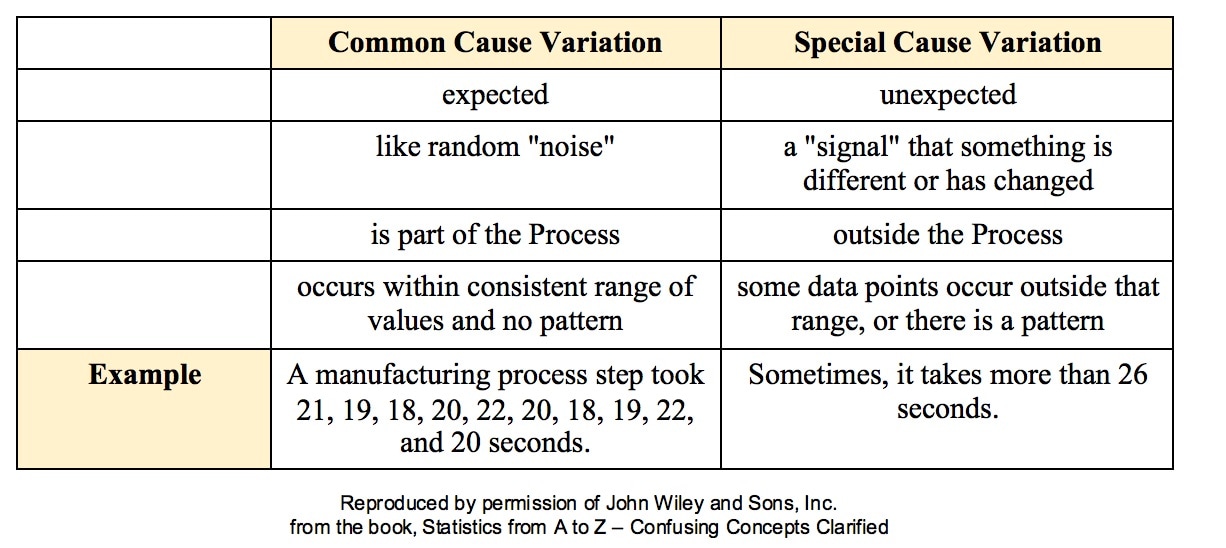
 All processes have variation. A process can be said to be "under control", "stable", or "predictable" if the variation is
Such Variation is called Common Cause Variation; it is like random "noise" within an under-control process. Variation which is not Common Cause is called Special Cause Variation. It is a signal that factors outside the process are affecting it. Any Special Cause Variation must be eliminated before one can attempt to narrow the range of Common Cause Variation. Until we eliminate Special Cause Variation, we don't have a process that we can improve. There are factors outside the process which affect it, and that changes the actual process that is happening in ways that we don't know. Once we know that we have Special Cause Variation, we can use various Root Cause Analysis methods to identify the Special Cause, so that we can eliminate it. Only then can we use process/ quality improvement methods like Lean Six Sigma to try to reduce the Common Cause Variation. Here are some examples of Special Causes of Variation:
Here is an example of a Control Chart. Each point is the Mean of a small Sample of data. The Upper Control Limit (UCL) and the Lower Control Limit (LCL) are usually set at 3 Standard Deviations from the Center Line. 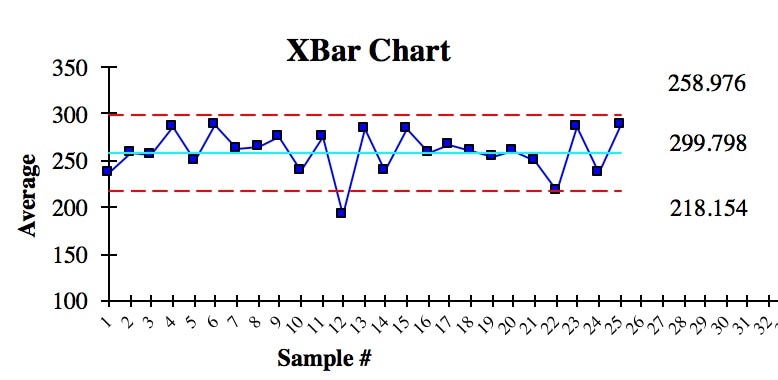 We see that there is one anomalous Sample Mean outside the Control Limits. This is due to Special Cause Variation. So, we need to do some root cause analysis to determine what caused that. And we need to make changes to eliminate it, before we can try to narrow the range of the Control Limits.
In addition to being within Control Chart limits, the data must be random. There are a number of Run Rules which describe patterns which are not random. Some patterns are not always easy to spot by eyeballing charts. Fortunately, the same software which produces Control Charts will usually also identify patterns described by the Run Rules. Here are some common patterns which indicate non-random (Special Cause) Variation. A Sigma is a Standard Deviation.
Reproduced by permission of John Wiley and Sons, Inc. from the book, Statistics from A to Z – Confusing Concepts Clarified
2 Comments
10/10/2020 11:36:26 pm
Vincent Like you have a lot of things to is going on and when I try to put in a goes to another line and Danny goes to another man how come I just want gold to what it to go and work in O what is it that it be here is it the system kidnap the is that the time is but is you made some areas controlling well seems to be Brandon as whose all white side and Woodside is almost sighed I don't know I'm just trying to you that albums as she questions where when I go will do 1A again get the president then I want I can't get into the love of my life the the Queen amount round table I can't get a row of her way he their part
RMAK
2/27/2021 07:28:48 am
Nicely explained Leave a Reply. |
AuthorAndrew A. (Andy) Jawlik is the author of the book, Statistics from A to Z -- Confusing Concepts Clarified, published by Wiley. Archives
March 2021
Categories |

 RSS Feed