STATISTICS FROM A TO Z<br />-- CONFUSING CONCEPTS CLARIFIED
  • Home
    • Why This Book Is Needed
    • Articles List, Additional Concepts
    • Examples: 1-Page Summaries
    • Examples: Concept Flow Diagram
    • Examples: Compare and Contrast Tables
    • Examples: Cartoons
    • Example: Which to Use When Article
  • Buy
  • Blog
  • Sample Articles
  • Videos
  • Author
  • Communicate
  • Files
  • Errata

Statistics Tip of the Week: Control Charts -- Which to use When

10/31/2017

0 Comments

 
​My blog post of April 6, 2017 discussed how Control Charts and Run Rules are used to distinguish Common Cause from Special Cause Variation. Common Cause Variation is the usual, expected, random "noise" variation that all processes have. It occurs within limits and it exhibits no pattern. If all we have is Common Cause Variation, then we can begin implementing process improvement techniques to reduce this variation.
Picture
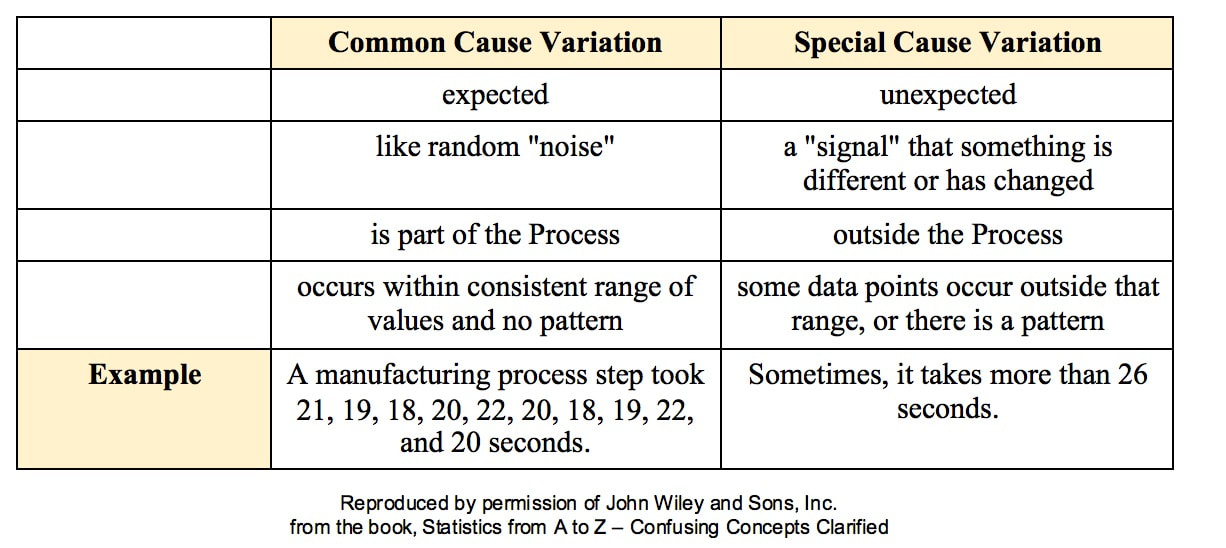
​But if the variation exceeds the limits in a Control Chart or if it exhibits patterns described in Run Rules, then the process in not in control. Special Cause Variation is in effect, and that needs to be addressed first.
 
There are a number of different types of Control Charts. For Discrete/ Count data (integers) here are the Control Charts to use. 
Picture
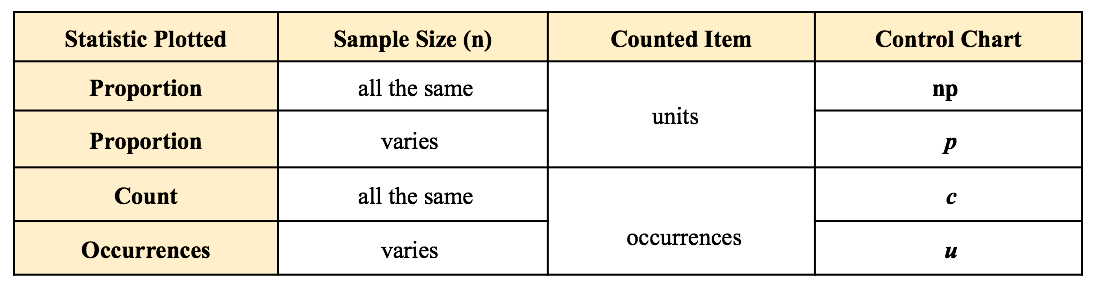
What's the difference between units and occurrences? Let's say we are inspecting shirts that we are manufacturing.  One shirt with 3 defects would count as 1 defective unit or 3 occurrences of defects.

For Continuous/ Measurement data (real numbers), use the following charts:
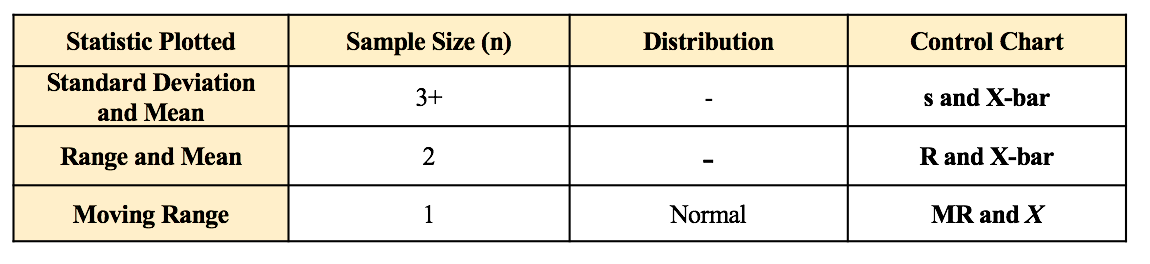
Picture
0 Comments


Leave a Reply.

    Author

    Andrew A. (Andy) Jawlik is the author of the book, Statistics from A to Z -- Confusing Concepts Clarified, published by Wiley.

    Archives

    March 2021
    December 2020
    November 2020
    October 2020
    September 2020
    August 2020
    May 2020
    March 2020
    February 2020
    January 2020
    December 2019
    November 2019
    October 2019
    September 2019
    July 2019
    June 2019
    May 2019
    April 2019
    March 2019
    February 2019
    January 2019
    December 2018
    November 2018
    October 2018
    September 2018
    August 2018
    July 2018
    June 2018
    May 2018
    April 2018
    March 2018
    February 2018
    January 2018
    December 2017
    November 2017
    October 2017
    September 2017
    August 2017
    July 2017
    June 2017
    May 2017
    April 2017
    March 2017
    February 2017
    January 2017
    December 2016
    November 2016
    October 2016
    September 2016
    August 2016

    Categories

    All
    New Video
    Stats Tip Of The Week
    You Are Not Alone

    RSS Feed

  • Home
    • Why This Book Is Needed
    • Articles List, Additional Concepts
    • Examples: 1-Page Summaries
    • Examples: Concept Flow Diagram
    • Examples: Compare and Contrast Tables
    • Examples: Cartoons
    • Example: Which to Use When Article
  • Buy
  • Blog
  • Sample Articles
  • Videos
  • Author
  • Communicate
  • Files
  • Errata