STATISTICS FROM A TO Z<br />-- CONFUSING CONCEPTS CLARIFIED
  • Home
    • Why This Book Is Needed
    • Articles List, Additional Concepts
    • Examples: 1-Page Summaries
    • Examples: Concept Flow Diagram
    • Examples: Compare and Contrast Tables
    • Examples: Cartoons
    • Example: Which to Use When Article
  • Buy
  • Blog
  • Sample Articles
  • Videos
  • Author
  • Communicate
  • Files
  • Errata

Statistics Tip: Analysis of Residuals is required for a Regression Model

10/3/2019

0 Comments

 
The purpose of Regression analysis is to develop a cause and effect "Model" in the form of an equation. To keep things simple, let's talk about Simple Linear Regression, in which the equation is

                                                                           y = bx + a
 
The Regression analysis comes up with the values for b and a.
Picture
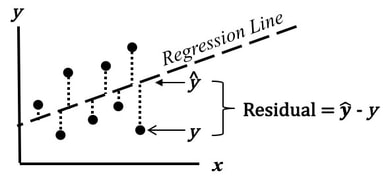
​Residuals represent the Error in the Regression Model. They represent the Variation in the y variable which is not explainedby the Regression Model. 
 
So, Residuals must be Random.  If not -- if Residuals form a pattern -- that is evidence that one or more additional factors (x's) influence y.
 
A Scatterplot of Residuals against y-values should illustrate Randomness: 
Picture
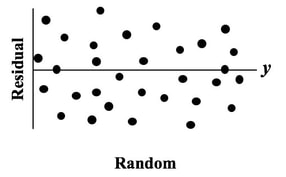
​Being Random means that the Residuals 
  • are Normally distributed
  • have constant Variance
  • show no patterns when graphed 
  • have no unexplained Outliers
 
Here are some patterns which indicate the Regression Model is incomplete. 
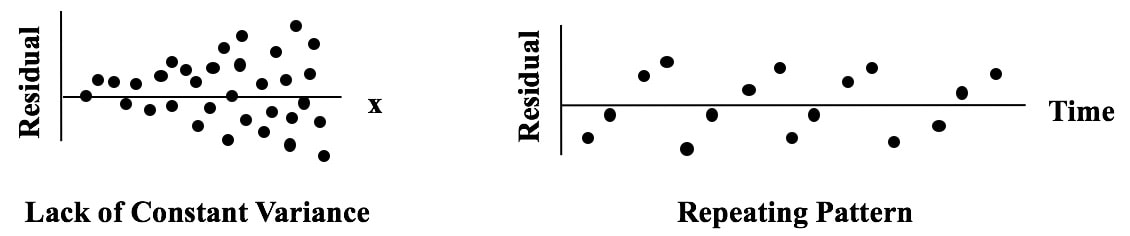
Picture
0 Comments


Leave a Reply.

    Author

    Andrew A. (Andy) Jawlik is the author of the book, Statistics from A to Z -- Confusing Concepts Clarified, published by Wiley.

    Archives

    March 2021
    December 2020
    November 2020
    October 2020
    September 2020
    August 2020
    May 2020
    March 2020
    February 2020
    January 2020
    December 2019
    November 2019
    October 2019
    September 2019
    July 2019
    June 2019
    May 2019
    April 2019
    March 2019
    February 2019
    January 2019
    December 2018
    November 2018
    October 2018
    September 2018
    August 2018
    July 2018
    June 2018
    May 2018
    April 2018
    March 2018
    February 2018
    January 2018
    December 2017
    November 2017
    October 2017
    September 2017
    August 2017
    July 2017
    June 2017
    May 2017
    April 2017
    March 2017
    February 2017
    January 2017
    December 2016
    November 2016
    October 2016
    September 2016
    August 2016

    Categories

    All
    New Video
    Stats Tip Of The Week
    You Are Not Alone

    RSS Feed

  • Home
    • Why This Book Is Needed
    • Articles List, Additional Concepts
    • Examples: 1-Page Summaries
    • Examples: Concept Flow Diagram
    • Examples: Compare and Contrast Tables
    • Examples: Cartoons
    • Example: Which to Use When Article
  • Buy
  • Blog
  • Sample Articles
  • Videos
  • Author
  • Communicate
  • Files
  • Errata