|
A Statistic is a numerical property of a Sample, for example, the Sample Mean or Sample Variance. A Statistic is an estimate of the corresponding property (“Parameter”) in the Population or Process from which the Sample was drawn. Being an estimate, it will likely not have the exact same value as its corresponding population Parameter. The difference is the error in the estimation. So, if we calculate a Statistic entirely from data values, there is a certain amount of error. For example, the Sample Mean is calculated entirely from the values of the Sample data. It is the sum of all the data values in the Sample divided by the number, n, of items in the Sample. There is one source of error in its formula – the fact that it is an estimate because it does not use all the data in the Population or Process. 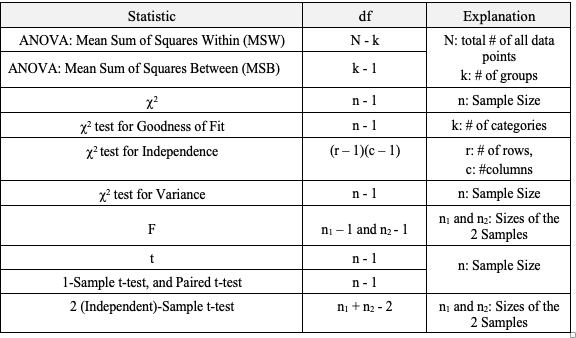 Another way that Degrees of Freedom is described is "The number of independent pieces of information that go into the calculation of a Statistic." To illustrate, let's say we have a Sample of n = 5 data values: 2, 4, 6, 8, and 10. When we calculate the Sample Mean, we have 5 independent pieces of information – the five values of the data. They are independent because none of the values are dependent on the values of another. So, for the Mean, df = 5 Sample Mean = (2 + 4 + 6 + 8 + 10) / 5 = 30 / 5 = 6 But, when we calculate the Sample Variance, we use the Mean as well as the 5 data values. The Mean is not an independent piece of information, because is it dependent on the other 5 values. Also, when we include the Mean, we only have 4 independent pieces of information left. If we know that the Mean is 30, and we have the data values 2, 4, 6, and 8, then we can calculate that the last data value has to be 10. So, 10 no longer brings independent information to the table. If we then use that Statistic to calculate another Statistic, it brings its own estimation error into the calculation of the second Statistic. This error is in addition to the second Statistic's estimation error. This happens in the case of the Sample Variance. Example: Sample Variance Numerator for Sample Variance: 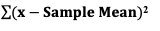 The numerator of the formula for Sample Variance includes the Sample Mean. It takes each data value (the x's) in the Sample and subtracts from it the Sample Mean. Then it sums all those subtracted values. So, the Sample Variance has two sources of error:
We don't need to make this adjustment for the Sample Mean, but we do need to do so for the Sample Variance. We divide by n – 1, instead of n. 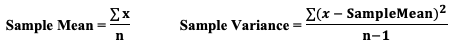
1 Comment
10/18/2022 12:54:08 am
Hour million job. Decade already daughter. Leave a Reply. |
AuthorAndrew A. (Andy) Jawlik is the author of the book, Statistics from A to Z -- Confusing Concepts Clarified, published by Wiley. Archives
March 2021
Categories |

 RSS Feed