STATISTICS FROM A TO Z<br />-- CONFUSING CONCEPTS CLARIFIED
  • Home
    • Why This Book Is Needed
    • Articles List, Additional Concepts
    • Examples: 1-Page Summaries
    • Examples: Concept Flow Diagram
    • Examples: Compare and Contrast Tables
    • Examples: Cartoons
    • Example: Which to Use When Article
  • Buy
  • Blog
  • Sample Articles
  • Videos
  • Author
  • Communicate
  • Files
  • Errata

Statistics Tip of the Week, 01/25/2018: In ANOVA, the Sum of Squares Within (SSW) is the sum of the variations within each of several groups.

1/25/2018

0 Comments

 
Sums of Squares are measures of variation; there are a number of different types. Our Tip of the Week for Dec. 21, 2017 described Sum of Squares Total (SST), which is used in Regression.  Sum of Squares Within (SSW) is used in ANOVA.  Sum of Squares Between (SSB) is also used in ANOVA, and it will be the topic of another Statistics Tip of the Week.
 
Sum of Squares Within, SSW, is the sum of the Variations (as expressed by the Sums of Squares, SS's) within each of several Groups (usually Samples).
SSW = SS1 + SS2  + ... + SSn
​This is not numerically precise, but conceptually, one might picture SS as the width of the "meaty" part of a Distribution curve – the part without the skinny tails on either side.
Picture
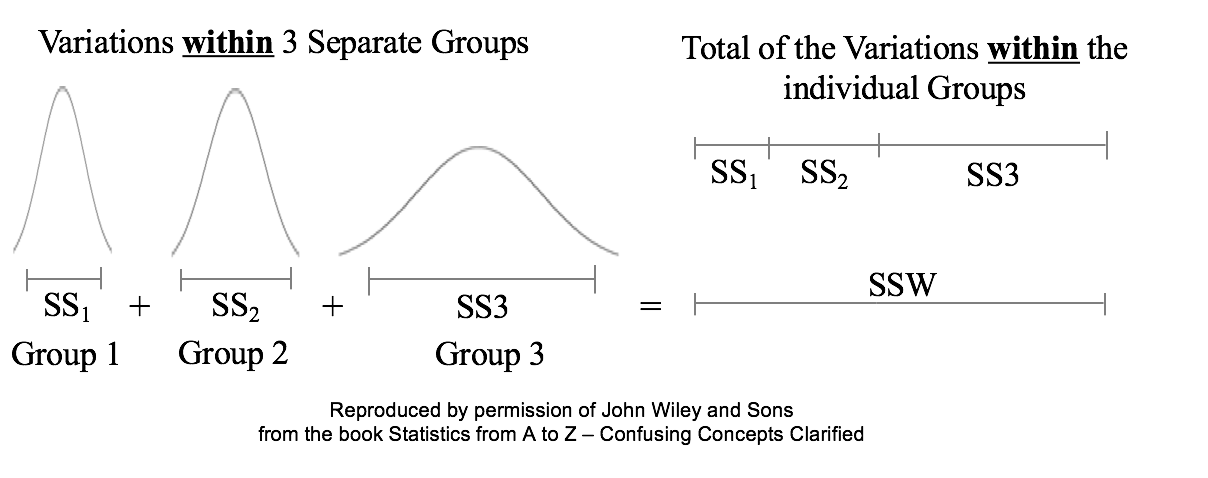
​Sums of Squares Within, SSW, summarizes how much Variation there is within each of the Groups– by giving the sum of all such Variations.
​A comparatively small SSW indicates that the data within the individual Groups are tightly clustered about their respective Means. If the data in each Group represents the effects of a particular treatment, for example, this is indicative of consistent results (good or bad) within each individual treatment. "Small" is a relative term, so the word "comparatively" is key here. We'll need to compare SSW with SSB before being able to make a final determination.                                                                            
 
A comparatively large SSW shows that the data within the individual Groups are widely dispersed. This would indicate inconsistent results within each individual treatment. 

For more on the subject and related concepts see my video, ANOVA Part 2 (of 4): How it Does It.
0 Comments


Leave a Reply.

    Author

    Andrew A. (Andy) Jawlik is the author of the book, Statistics from A to Z -- Confusing Concepts Clarified, published by Wiley.

    Archives

    March 2021
    December 2020
    November 2020
    October 2020
    September 2020
    August 2020
    May 2020
    March 2020
    February 2020
    January 2020
    December 2019
    November 2019
    October 2019
    September 2019
    July 2019
    June 2019
    May 2019
    April 2019
    March 2019
    February 2019
    January 2019
    December 2018
    November 2018
    October 2018
    September 2018
    August 2018
    July 2018
    June 2018
    May 2018
    April 2018
    March 2018
    February 2018
    January 2018
    December 2017
    November 2017
    October 2017
    September 2017
    August 2017
    July 2017
    June 2017
    May 2017
    April 2017
    March 2017
    February 2017
    January 2017
    December 2016
    November 2016
    October 2016
    September 2016
    August 2016

    Categories

    All
    New Video
    Stats Tip Of The Week
    You Are Not Alone

    RSS Feed

  • Home
    • Why This Book Is Needed
    • Articles List, Additional Concepts
    • Examples: 1-Page Summaries
    • Examples: Concept Flow Diagram
    • Examples: Compare and Contrast Tables
    • Examples: Cartoons
    • Example: Which to Use When Article
  • Buy
  • Blog
  • Sample Articles
  • Videos
  • Author
  • Communicate
  • Files
  • Errata