STATISTICS FROM A TO Z<br />-- CONFUSING CONCEPTS CLARIFIED
  • Home
    • Why This Book Is Needed
    • Articles List, Additional Concepts
    • Examples: 1-Page Summaries
    • Examples: Concept Flow Diagram
    • Examples: Compare and Contrast Tables
    • Examples: Cartoons
    • Example: Which to Use When Article
  • Buy
  • Blog
  • Sample Articles
  • Videos
  • Author
  • Communicate
  • Files
  • Errata

Statistics Tip:  A comparison of various measures of Variation

1/30/2019

0 Comments

 
Variation is also known as "Variability", "Dispersion", "Spread", and "Scatter". (5 names for one thing is one more example why statistics is confusing.) Variation is 1 of 3 major categories of measures describing a Distribution or data set. The others are Center (aka "Central Tendency") with measures like Mean, Mode, and Median and Shape (with measures like Skew and Kurtosis). Variation measures how "spread out" the data is.
Picture
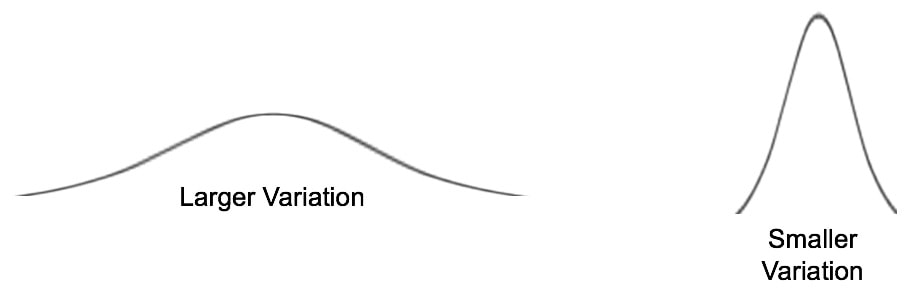
​There are a number of different measures of Variation. This compare-and-contrast table shows the relative merits of each.
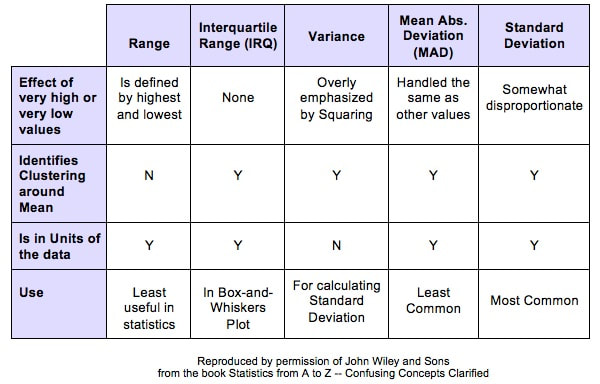
Picture
  • The Range is probably the least useful in statistics. It just tells you the highest and lowest values of a data set, and nothing about what's in between.
  • The Interquartile Range (IQR) can be quite useful for visualizing the distribution of the data and for comparing several data sets -- as described in a recent post on this blog.
  • Variance is the square of the Standard Deviation, and it is used as an interim step in the calculation of the latter. This squaring overly emphasizes the effects very high or very low values. Another drawback is that it is in units of the data squared (e.g. square kilograms, which can be meaningless). There is a Chi-Square Test for the Variance, and Variances are used in F tests and the calculations in ANOVA.
  • The Mean Absolute Deviation is the average (unsquared) distance of the data points from the Mean. It is used when it is desirable to avoid emphasizing the effects of high and low values 
  • The Standard Deviation, being the square root of the Variance, does not overly emphasize the high and low values as the Variance does. Another major benefit is that it is in the same units as the data.
0 Comments


Leave a Reply.

    Author

    Andrew A. (Andy) Jawlik is the author of the book, Statistics from A to Z -- Confusing Concepts Clarified, published by Wiley.

    Archives

    March 2021
    December 2020
    November 2020
    October 2020
    September 2020
    August 2020
    May 2020
    March 2020
    February 2020
    January 2020
    December 2019
    November 2019
    October 2019
    September 2019
    July 2019
    June 2019
    May 2019
    April 2019
    March 2019
    February 2019
    January 2019
    December 2018
    November 2018
    October 2018
    September 2018
    August 2018
    July 2018
    June 2018
    May 2018
    April 2018
    March 2018
    February 2018
    January 2018
    December 2017
    November 2017
    October 2017
    September 2017
    August 2017
    July 2017
    June 2017
    May 2017
    April 2017
    March 2017
    February 2017
    January 2017
    December 2016
    November 2016
    October 2016
    September 2016
    August 2016

    Categories

    All
    New Video
    Stats Tip Of The Week
    You Are Not Alone

    RSS Feed

  • Home
    • Why This Book Is Needed
    • Articles List, Additional Concepts
    • Examples: 1-Page Summaries
    • Examples: Concept Flow Diagram
    • Examples: Compare and Contrast Tables
    • Examples: Cartoons
    • Example: Which to Use When Article
  • Buy
  • Blog
  • Sample Articles
  • Videos
  • Author
  • Communicate
  • Files
  • Errata