|
A method for performing 1-way (single factor) ANOVA can be illustrated in 7 steps, as shown in this concept flow diagram: 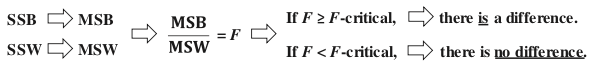 A Sum of Squares SS, is a measure of Variation within one Sample. In fact, it is the numerator in the formula for Variance. SSB and SSW are described further in two of my recent Tips of the Week. And this 7-Step method is covered in my video: ANOVA -Part 3 (of 4): 1-Way aka Single Factor. Step 1. Calculate the Sum of Squares (SS) for each Sample. 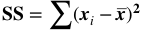 SS is a measure of Variation within one Sample. In fact, it is the numerator in the formula for Variance. Step 2. Add all these up for all Samples to get the Sum of Squares Within. SSW 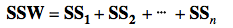 SSW is a measure of the Variation within all the Samples. Step 3. Calculate the Overall Mean, of all the data values in all Samples. Forget which data values go with which Samples, just put them all in one bucket and calculate the Mean. Step 4: Sum up the squared differences between each Sample Mean (X-bar) and the Overall Mean (X double bar), to get Sum of Squares Between. 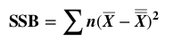 Step 5: Calculate the Mean Sum of Squares Within (MSW) and Between (MSB). Sums of differences (like SSW and SSB) provide a gross measure of Variation. But it is often not meaningful to compare sums of different numbers of things. Averages (Means) are generally more meaningful than totals. So, we calculate MSW and MSB. 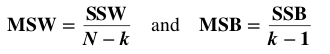 Step 6: Perform an F-test The crux of ANOVA is comparing the Variation Within groups to the Variation Between (Among) groups. A group is a dataset like a population, process, or sample. The best way to do a comparison is to calculate a ratio. The F-statistic is a ratio of two Variances, MSB and MSW. 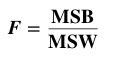 Note that this is a different concept from the usual F-test comparing Variances of two Samples. In that case, the Null Hypothesis would be that there is not a Statistically Significant difference between the Variances of two Samples. Although MSB and MSW have formulas like Variances, MSB and MSW contain information about the differences between the Means of the several groups. They contain no information about the Variances of the groups.
In the F-Test within ANOVA, the ANOVA Null Hypothesis is that there is not a Statistically Significant difference between MSB and MSW – that is, there is not a Statistically Significant difference among the Means of the several Groups. Step 7: Our choice of the Significance Level, Alpha, (most commonly 5%) determines the value of F-critical, and the F-statistic (calculated from the Sample data) determines the value of the Probability p. Comparing p to 𝛼 is identical to comparing F and F-critical. If F ≥ F-critical (equivalently, p ≤ 𝜶), then there is a Statistically Significant difference between the Means of the groups. (Reject the ANOVA Null Hypothesis). If F < F-critical (p > 𝜶), then there is not Statistically Significant difference between the Means of the groups. (Accept/Fail to Reject the ANOVA Null Hypothesis).
0 Comments
Leave a Reply. |
AuthorAndrew A. (Andy) Jawlik is the author of the book, Statistics from A to Z -- Confusing Concepts Clarified, published by Wiley. Archives
March 2021
Categories |

 RSS Feed