|
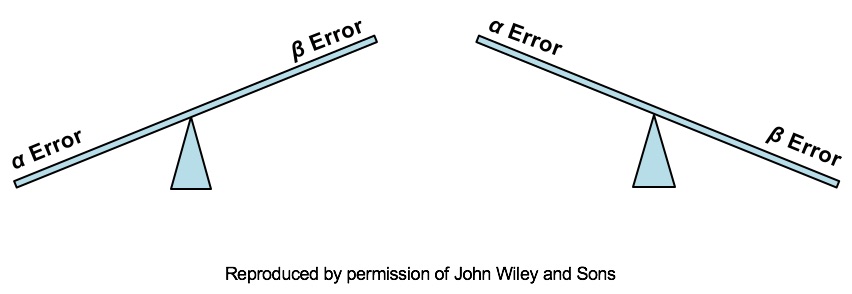
Last week's post was the first of this regular series of blog posts: the "Statistics Tip of the Week". There are a number of see-saws (aka "teeter-totters" or "totterboards") like this in statistics that we'll be seeing in the coming weeks and months. Here, we see that, as the Probability of an Alpha Error goes down, the Probability of a Beta Error goes up. Likewise, as the Probability of an Alpha Error goes up, the Probability of a Beta Error goes down. This being statistics, it would not be confusing enough if there were just one name for a concept. So, you may know Alpha and Beta Errors by different names:
We'll go into more detail on Alpha and Beta Errors in a future blog post. but the following compare-and-contrast table should help explain the difference: The see-saw effect is important when we are selecting a value for Alpha (α) as part of a Hypothesis test. Most commonly, α = 0.05 is selected. This gives us a 1 – 0.05 = 0.95 (95%) Probability of avoiding an Alpha Error.
Since the person performing the test is the one who gets to select the value for Alpha, why don't we always select α = 0.000001 or something like that? The answer is, selecting a low value for Alpha comes at price. Reducing the risk of an Alpha Error increases the risk of a Beta Error, and vice versa.
3 Comments
Andrew A Jawlik
12/17/2020 07:33:20 am
Glad you found it helpful
Reply
Leave a Reply. |
AuthorAndrew A. (Andy) Jawlik is the author of the book, Statistics from A to Z -- Confusing Concepts Clarified, published by Wiley. Archives
March 2021
Categories |


 RSS Feed