STATISTICS FROM A TO Z<br />-- CONFUSING CONCEPTS CLARIFIED
  • Home
    • Why This Book Is Needed
    • Articles List, Additional Concepts
    • Examples: 1-Page Summaries
    • Examples: Concept Flow Diagram
    • Examples: Compare and Contrast Tables
    • Examples: Cartoons
    • Example: Which to Use When Article
  • Buy
  • Blog
  • Sample Articles
  • Videos
  • Author
  • Communicate
  • Files
  • Errata

Statistics Tip of the Week:  The values in a Sampling Distribution are not data but Statistics of Samples.

11/29/2017

1 Comment

 
The concept of Sampling Distribution may not be used so much used on its own as it is used in describing the concepts of the Central Limit Theorem and Standard Error:
  • Central Limit Theorem: Even if the data are not Normally distributed, the Sampling Distribution of the Means or Proportions of the data approaches the Normal Distribution as the Sample Size, n, increases.
  • The Standard Error is defined as the Standard Deviation of the Sampling Distribution.
In this Tip of the week, we're not going to go into those two concepts any further; we'll just focus on Sampling Distribution.
 
The visual we're going to use is similar to a Dot Plot of a Sample of data. Each dot represents a single value of x in the Sample. In the example below, 6 values in the Sample were x = 14, so we show 6 dots over "14" on the horizontal x-axis.
Picture
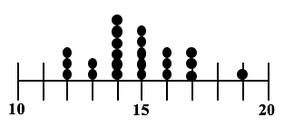
​In a Sampling Distribution, the values which are plotted are not individual data points as in this dot plot. The values are Statistics calculated from Samples. Statistics are numerical properties of Samples, such as the Mean or Proportion or Standard Deviation. Let's show a plot of the Means of some Samples of data. Instead of a dot, we'll show each Mean as an x-bar symbol.
Picture
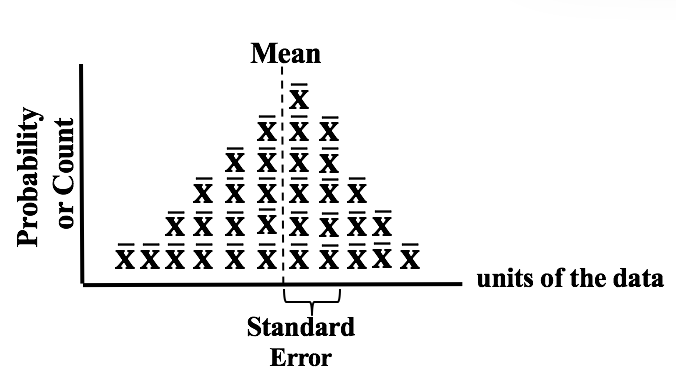
The x-bars are stacked vertically above the x axis at the point which represents their value. The height of each stack corresponds to the Probability of that value of the Mean.
​
This illustration shows a Sampling Distribution. The Sampling Distribution would show the Means of every possible Sample of a given size, n.
 
You can see that the x-bars form a shape which roughly resembles a Normal Distribution. If we had many more Samples with a large n, the resemblance would be much closer. And if we calculate the Standard Deviation of the Distribution, we would get the Standard Error of the Mean.
1 Comment
Ana Carol link
4/16/2023 02:38:12 pm

Thank you for explaining the concept of Sampling Distribution so clearly. It can be confusing to differentiate between data points and statistics of samples, but your use of visuals helped to clarify this distinction. I also appreciated your explanation of how the Central Limit Theorem and Standard Error are related to Sampling Distribution. This post serves as a helpful reminder of these important statistical concepts.

Reply


Leave a Reply.

    Author

    Andrew A. (Andy) Jawlik is the author of the book, Statistics from A to Z -- Confusing Concepts Clarified, published by Wiley.

    Archives

    March 2021
    December 2020
    November 2020
    October 2020
    September 2020
    August 2020
    May 2020
    March 2020
    February 2020
    January 2020
    December 2019
    November 2019
    October 2019
    September 2019
    July 2019
    June 2019
    May 2019
    April 2019
    March 2019
    February 2019
    January 2019
    December 2018
    November 2018
    October 2018
    September 2018
    August 2018
    July 2018
    June 2018
    May 2018
    April 2018
    March 2018
    February 2018
    January 2018
    December 2017
    November 2017
    October 2017
    September 2017
    August 2017
    July 2017
    June 2017
    May 2017
    April 2017
    March 2017
    February 2017
    January 2017
    December 2016
    November 2016
    October 2016
    September 2016
    August 2016

    Categories

    All
    New Video
    Stats Tip Of The Week
    You Are Not Alone

    RSS Feed

  • Home
    • Why This Book Is Needed
    • Articles List, Additional Concepts
    • Examples: 1-Page Summaries
    • Examples: Concept Flow Diagram
    • Examples: Compare and Contrast Tables
    • Examples: Cartoons
    • Example: Which to Use When Article
  • Buy
  • Blog
  • Sample Articles
  • Videos
  • Author
  • Communicate
  • Files
  • Errata