STATISTICS FROM A TO Z<br />-- CONFUSING CONCEPTS CLARIFIED
  • Home
    • Why This Book Is Needed
    • Articles List, Additional Concepts
    • Examples: 1-Page Summaries
    • Examples: Concept Flow Diagram
    • Examples: Compare and Contrast Tables
    • Examples: Cartoons
    • Example: Which to Use When Article
  • Buy
  • Blog
  • Sample Articles
  • Videos
  • Author
  • Communicate
  • Files
  • Errata

Statistics Tip of the Week: What's the difference between a Bar Chart and a Histogram?

4/20/2017

0 Comments

 
Picture
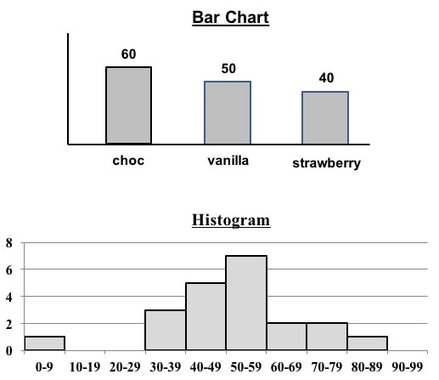
Both Bar Charts and Histograms use the height of bars (rectangles of the same width) to visually depict data. So, they look similar.
 
But, they
  1. differ in whether the bars are separated or placed together (contiguous)
  2. depict different types of data, and
  3. are used for different purposes
 
1. Separated or contiguous
  • Bar Charts: separated
  • Histograms: contiguous (the example pictured appears to not be contiguous only because the count is zero for the bins 10-19 and 20-29).
 
2. Types of data
  • Bar Charts: Counts or Percentages of Nominal (also known as "Categorical") Variables. These Variables have names as their values (e.g. "chocolate", "vanilla", "strawberry"), not numbers.
  • Histograms: Counts or Percentages or Probabilities of the number of data points within a Range 
 
3. How Used
  • Bar Charts are used to display relative sizes (of the counts of the named values). 
  • Histograms are used to display the shape of the Distribution of the data. The Histogram pictured above tells us that the data is roughly Normally Distributed.
0 Comments


Leave a Reply.

    Author

    Andrew A. (Andy) Jawlik is the author of the book, Statistics from A to Z -- Confusing Concepts Clarified, published by Wiley.

    Archives

    March 2021
    December 2020
    November 2020
    October 2020
    September 2020
    August 2020
    May 2020
    March 2020
    February 2020
    January 2020
    December 2019
    November 2019
    October 2019
    September 2019
    July 2019
    June 2019
    May 2019
    April 2019
    March 2019
    February 2019
    January 2019
    December 2018
    November 2018
    October 2018
    September 2018
    August 2018
    July 2018
    June 2018
    May 2018
    April 2018
    March 2018
    February 2018
    January 2018
    December 2017
    November 2017
    October 2017
    September 2017
    August 2017
    July 2017
    June 2017
    May 2017
    April 2017
    March 2017
    February 2017
    January 2017
    December 2016
    November 2016
    October 2016
    September 2016
    August 2016

    Categories

    All
    New Video
    Stats Tip Of The Week
    You Are Not Alone

    RSS Feed

  • Home
    • Why This Book Is Needed
    • Articles List, Additional Concepts
    • Examples: 1-Page Summaries
    • Examples: Concept Flow Diagram
    • Examples: Compare and Contrast Tables
    • Examples: Cartoons
    • Example: Which to Use When Article
  • Buy
  • Blog
  • Sample Articles
  • Videos
  • Author
  • Communicate
  • Files
  • Errata