|
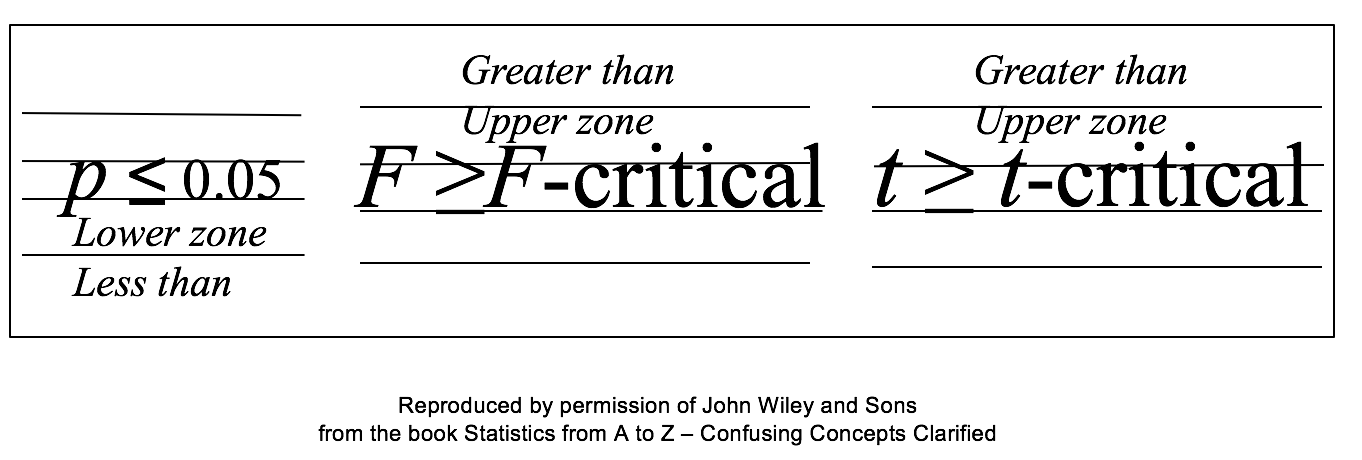
We run into p and Test Statistics – such as t, F, z, and χ2 – in a number of statistical tests, such as t-tests, F-tests, and ANOVA. After performing one of these tests, we come to a conclusion based on whether p ≤ or > 0.05 (or other value for Alpha) – or whether t < or > t-critical. But beginners can sometimes forget which way the "<" or ">" is supposed to point: Does p < Alpha tells us that there is or is not a Statistically Significant difference? The following is a non-statistical gimmick, but it may be helpful for some – it was for me. In this book, we don't focus on confusing things like the "nothingness" of the Null Hypothesis. We focus on something that does exist – like a difference, a change or an effect. So, to make things easy, we want a memory cue that tells us when there is something, as opposed to nothing. We can come to the following conclusions (depending on the test): Q: But how do we remember which way the inequality symbol should go? The book gives 3 rules and a statistical explanation and the following visual cue:
Remember back in kindergarten or first grade, when you were learning how to print? The letters of the Alphabet were aligned in 3 zones – middle, upper, and lower as below. p is different from t or F, because p extends into the lower zone, while F, t, and χ2 extend into the upper zone. (z doesn't; it stays in the middle zone. But we can remember that z is similar to t.) If we associate the lower zone with less than, and the upper zone with greater than, we have the following memory cue:
1 Comment
Great article! Thanks for the helpful memory cue to remember which way the inequality symbol should go when comparing p to Alpha or a Test Statistic to the Critical value. The unique thing I found in this article is the association of the lower zone with less than and the upper zone with greater than.
Reply
Leave a Reply. |
AuthorAndrew A. (Andy) Jawlik is the author of the book, Statistics from A to Z -- Confusing Concepts Clarified, published by Wiley. Archives
March 2021
Categories |


 RSS Feed