|
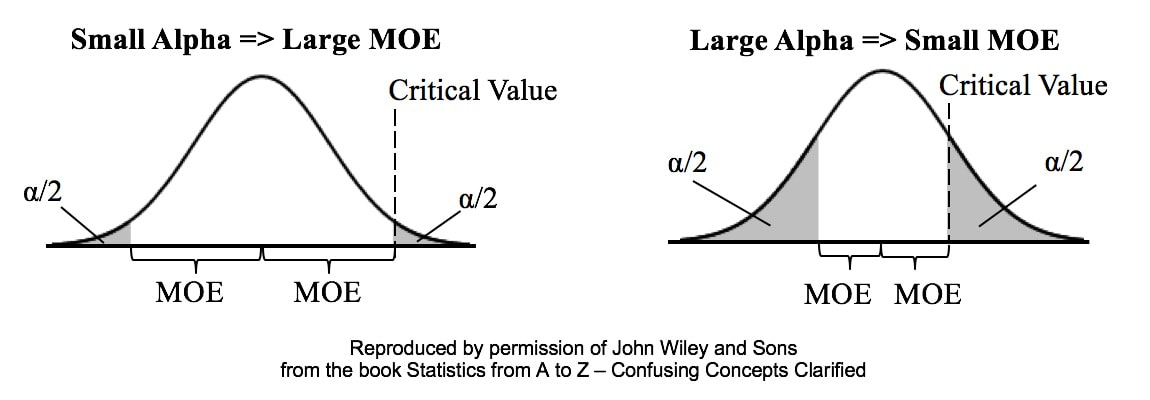
Alpha is the Significance Level of a statistical test. We select a value for Alpha based on the level of Confidence we want that the test will avoid a False Positive (aka Alpha aka Type I) Error. In the diagrams below, Alpha is split in half and shown as shaded areas under the right and left tails of the Distribution curve. This is for a 2-tailed, aka 2-sided test. In the left graph above, we have selected the common value of 5% for Alpha. A Critical Value is the point on the horizontal axis where the shaded area ends. The Margin of Error (MOE) is half the distance between the two Critical Values.
A Critical Value is a value on the horizontal axis which forms the boundary of one of the shaded areas. And the Margin of Error is half the distance between the Critical Values. If we want to make Alpha even smaller, the distance between Critical Values would get even larger, resulting in a larger Margin of Error. The right diagram shows that if we want to make the MOE smaller, the price would be larger Alpha. This illustrates the Alpha - MOE see-saw effect. But what if we wanted a smaller MOE without making Alpha larger? Is that possible? It is -- by increasing n, the Sample Size. (It should be noted that, after a certain point, continuing to increase n yields diminishing returns. So, it's not a universal cure for these errors.) If you'd like to learn more about Alpha, I have 2 YouTube videos which may be of interest:
0 Comments
Leave a Reply. |
AuthorAndrew A. (Andy) Jawlik is the author of the book, Statistics from A to Z -- Confusing Concepts Clarified, published by Wiley. Archives
March 2021
Categories |


 RSS Feed