|
The Central Limit Theorem (CLT) is a powerful concept, because it enables us to use the known Probabilities of the Normal Distribution in statistical analyses of data which are not Normally distributed. It is most commonly known as applying to the Means of Samples of data. 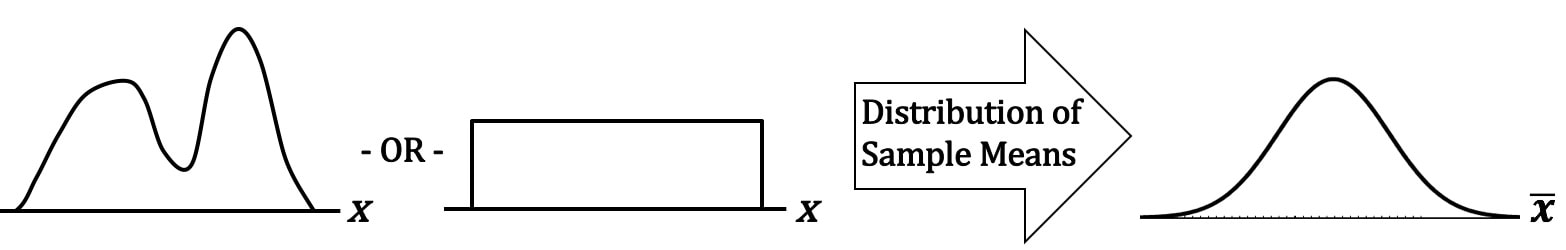 The data can be distributed in any way. For example -- as shown above -- it can be double-peaked and asymmetrical, or it can have the same number of points for every value of x. If we take many sufficiently large Samples of data with any Distribution, the Distribution of the Means (x-bar)'s of these Samples will be approximate the Normal Distribution. There is something intuitive about the CLT. The Mean of a Sample taken from any Distribution is very unlikely to be at the far left or far right of the range of the Distribution. Means (averages), by their very definition, tend to average-out extremes. So, their Probabilities would be highest in the center of a Distribution and lowest at the extreme left or right. Less intuitively obvious is that the CLT applies to Proportions as well as to Means. 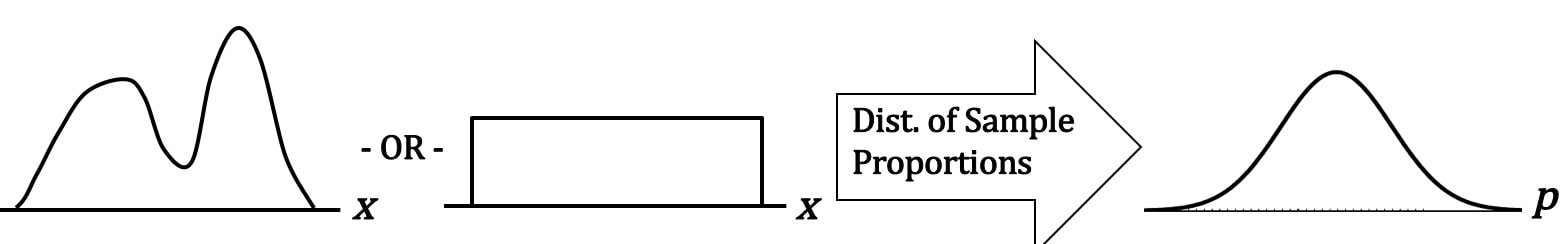 Let's say that pis the Proportion of the count of a category of items in a Sample, say the Proportion of green jelly beans in a candy bin. We take many Samples, with replacement, of the same size n, and we calculate the Proportion for each Sample. When we graph these Proportions, they will approximate a Normal Distribution. How large of a Sample Size, n, is "sufficiently large"? It depends on the use and the statistic. For Means and most uses n > 30 is considered large enough. But for Proportions, it's a little more complicated -- it depends on what the value of p is. n is large enough if np > 5 and n(1 - p) > 5. The practical effect of this is:
This table gives us the specifics; the minimum Sample Size, n, is shown in the middle row. 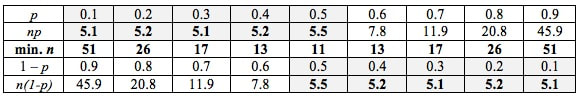
0 Comments
Leave a Reply. |
AuthorAndrew A. (Andy) Jawlik is the author of the book, Statistics from A to Z -- Confusing Concepts Clarified, published by Wiley. Archives
March 2021
Categories |

 RSS Feed