STATISTICS FROM A TO Z<br />-- CONFUSING CONCEPTS CLARIFIED
  • Home
    • Why This Book Is Needed
    • Articles List, Additional Concepts
    • Examples: 1-Page Summaries
    • Examples: Concept Flow Diagram
    • Examples: Compare and Contrast Tables
    • Examples: Cartoons
    • Example: Which to Use When Article
  • Buy
  • Blog
  • Sample Articles
  • Videos
  • Author
  • Communicate
  • Files
  • Errata

Statistics Tip: the F and Chi-square Tests of Variance

8/9/2018

0 Comments

 
​Most users of statistics are familiar with the F-test for Variances. But there is also a Chi-Square Test for the Variance. What's the difference?
​The F-test compares the Variances from 2 different Populations or Processes. It basically divides one Variance by the other and uses the appropriate F Distribution to determine whether there is a Statistically Significant difference.

If you're familiar with t-tests, the F-test is analogous to the 2-Sample t-test. The F-test is a Parametric test. It requires that the data from both the 2 Samples each be roughly Normal.

The following  compare-and-contrast table may help clarify these concepts:
Picture
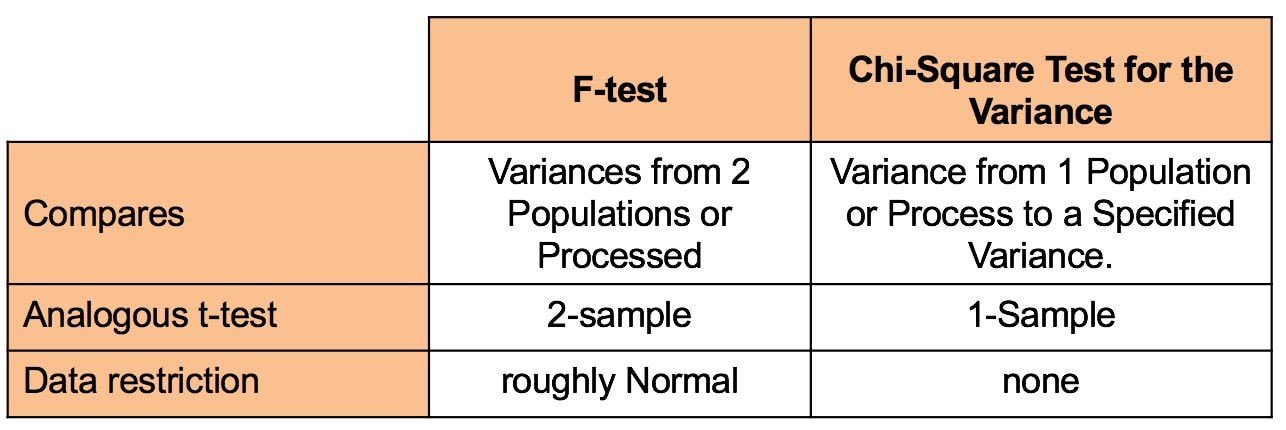
​Chi-Square (like z, t, and F) is a Test Statistic. That is, it has an associated family of Probability Distributions.
 
The Chi-Square Test for the Variance compares the Variance from a Single Population or Process to a Variance that we specify. That specified Variance could be a target value, a historical value, or anything else.
 
Since there is only 1 Sample of data from the single Population or Process, the Chi-Square test is analogous to the 1-Sample t-test.
 
In contrast to the the F-test, the Chi-Square test is Nonparametric. It has no restrictions on the data. 

Videos: I have published the following relevant videos on my YouTube channel, "Statistics from A to Z"
  • F Distribution:  https://youtu.be/w1TvaQgoNCY 
  • Chi-Square -- the Test Statistic and Its Distributions: https://youtu.be/RJMNkzuxOA4   
  • t: the Test Statistic and Its Distributions: youtu.be/3GCJU_RCgoM    
0 Comments


Leave a Reply.

    Author

    Andrew A. (Andy) Jawlik is the author of the book, Statistics from A to Z -- Confusing Concepts Clarified, published by Wiley.

    Archives

    March 2021
    December 2020
    November 2020
    October 2020
    September 2020
    August 2020
    May 2020
    March 2020
    February 2020
    January 2020
    December 2019
    November 2019
    October 2019
    September 2019
    July 2019
    June 2019
    May 2019
    April 2019
    March 2019
    February 2019
    January 2019
    December 2018
    November 2018
    October 2018
    September 2018
    August 2018
    July 2018
    June 2018
    May 2018
    April 2018
    March 2018
    February 2018
    January 2018
    December 2017
    November 2017
    October 2017
    September 2017
    August 2017
    July 2017
    June 2017
    May 2017
    April 2017
    March 2017
    February 2017
    January 2017
    December 2016
    November 2016
    October 2016
    September 2016
    August 2016

    Categories

    All
    New Video
    Stats Tip Of The Week
    You Are Not Alone

    RSS Feed

  • Home
    • Why This Book Is Needed
    • Articles List, Additional Concepts
    • Examples: 1-Page Summaries
    • Examples: Concept Flow Diagram
    • Examples: Compare and Contrast Tables
    • Examples: Cartoons
    • Example: Which to Use When Article
  • Buy
  • Blog
  • Sample Articles
  • Videos
  • Author
  • Communicate
  • Files
  • Errata