|
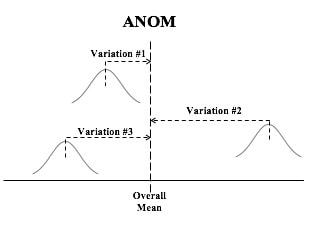
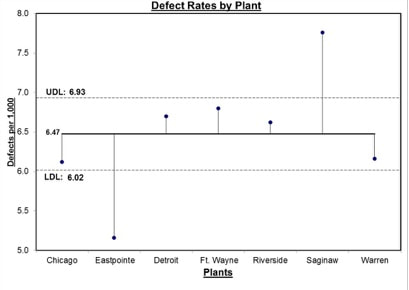
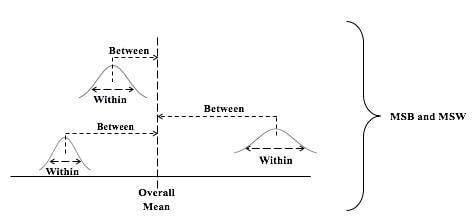
In the Tip for September 8, 2018, we listed a number of things that ANOVA can and can't do. One of these was that ANOVA can tell us whether or not there is a Statistically Significant difference among several Means, but it cannot tell us which ones are different from the others to a Statistically Significant amount. Let's say we're comparing 3 Groups (Populations or Processes) from which we've taken Samples of data. ANOM calculates the Overall Mean of all the data from all Samples, and then it measures the variation of each Group Mean from that. In the conceptual diagram below, each Sample is depicted by a Normal curve. The distance between each Sample Mean and the Overall Mean is identified as a "variation". ANOM retains the identity of the source of each of these variations (#1, #2, and #3), and it displays this graphically in an ANOM chart like the one below. In this ANOM chart, we are comparing the defect rates in a Process at 7 manufacturing plants. The dotted horizontal lines, the Upper Decision Line, UDL and Lower Decision Line, LDL, define a Confidence Interval, in this case, for α = 0.05. Our conclusion is that only Eastpointe (on the low side) and Saginaw (on the high side) exhibit a Statistically Significant difference in their Mean defect rates. So ANOM tells us not only whether any plants are Significantly different, but which ones are. In ANOVA, however, the individual identities of the Groups are lost during the calculations. The 3 individual variations Betweenthe individual Means and the Overall Mean are summarized into one Statistic, MSB, the Mean Sum of Squares Between. And the 3 variations Within each Group are summarized into another Statistic, MSW, the Mean Sum of Squares Within.
0 Comments
Leave a Reply. |
AuthorAndrew A. (Andy) Jawlik is the author of the book, Statistics from A to Z -- Confusing Concepts Clarified, published by Wiley. Archives
March 2021
Categories |


 RSS Feed