|
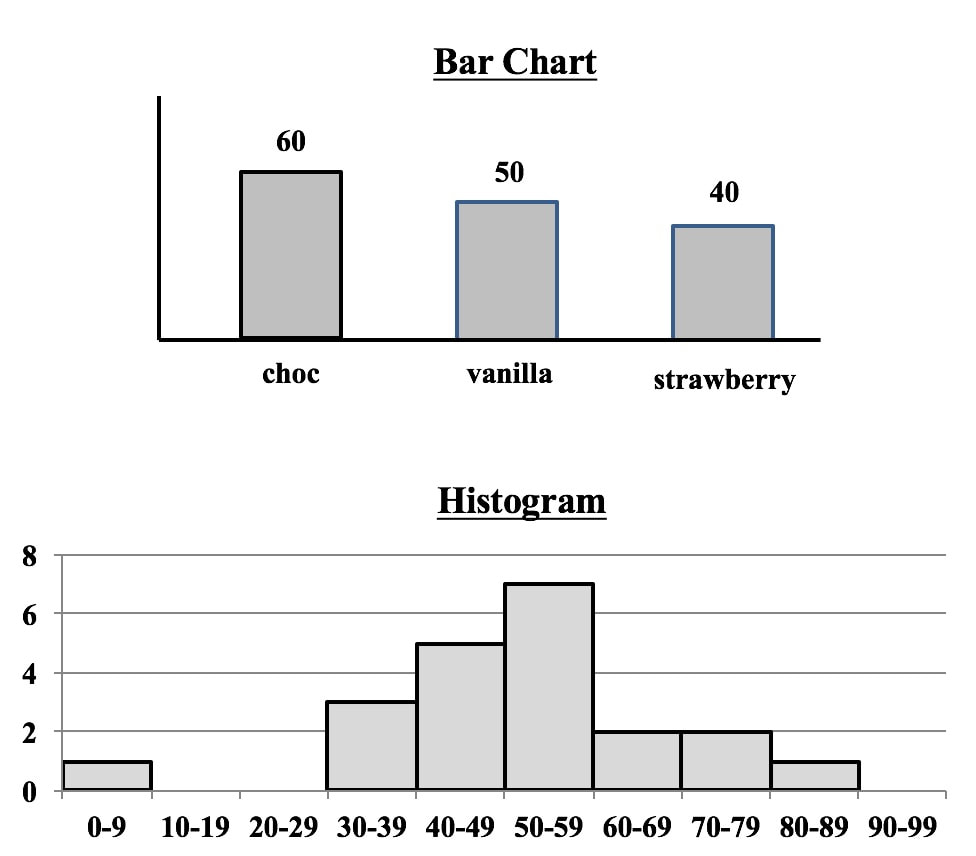
Both Bar Charts and Histograms use the height of bars (rectangles of the same width) to visually depict data. So, they look similar.
But, they
1. Separated or contiguous
2. Types of data
3. How Used
0 Comments
Leave a Reply. |
AuthorAndrew A. (Andy) Jawlik is the author of the book, Statistics from A to Z -- Confusing Concepts Clarified, published by Wiley. Archives
March 2021
Categories |


 RSS Feed