|
A Statistic is a numerical property calculated from Sample data. A Test Statistic is one which has an associated Probability Distribution. Given a value for a Test Statistic, the Probability Distribution will tell us the Probability of that value occurring. How this is used in statistical tests and Hypothesis Testing is described in my video on the concept of Test Statistic. There are 4 commonly-used Test Statistics -- z, t, F, and Chi-Square. They are used in different types of test as summarized in the table below: 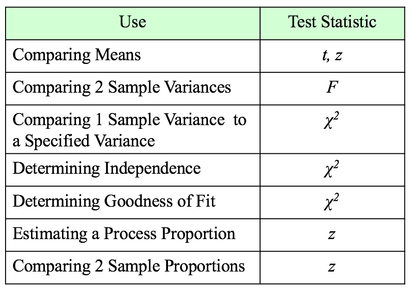 Both t and z can be used in comparing Means. The test will tell you whether there is a Statistically Significant difference between the Means. But z has some shortcomings, especially when the Sample Size, n, is not large. So, it's probably best to use t for comparing Means. There are 3 different types of t-tests:
The 1-Sample t-test compares a specified Mean to the Mean calculated from 1 Sample of data. The specified Mean can be a target value, a historical value, an estimate, or anything else. The difference between the 2-Sample and Paired t-test is explained in my first blog post, back in Sept. 22, 2016. The Mean is one Statistic. The Variance is another. There are two different Test Statistics used with Variances: F and Chi-Square 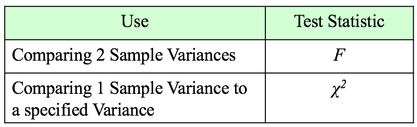 If we want to determine if there is a Statistically Significant different in the Variance of 2 Populations or Processes, we use the Test Statistic F and an F-Test. This is analogous to the 2-Sample t-test. If, on the other hand, we want to compare the Variance of a Population or Process to a specified Variance, we use the Chi-Square Test Statistic and the Chi-Square Test for the Variance. This test is analogous to the 1-Sample t-test. Chi-Square is a versatile Test Statistic, It is used in 2 other types of statistical tests:
The Chi-Square Test for Independence can tell us, for example, whether or not gender and ice-cream preference are independent (males and females show similar preferences) or dependent (one gender likes a given flavor and the other gender likes another.) The test is needed to determine if any observed difference is Statistically Significant. And the Chi Square Test for Goodness of Fit can tell us whether there is a Statistically Significant difference between a set of expected or predicted Frequencies (percentages converted to Counts) and the actual Frequencies shown in a Sample of data. For example, we might predict the set of percentages of customers each day as shown in the "Expected" row in the table below. And the "Observed" counts would be the number of customers who actually came. Is the expected/ predicted set of percentages a good fit with the actual? A "good fit" means that there is not a Statistically Significant difference between Expected and Observed. 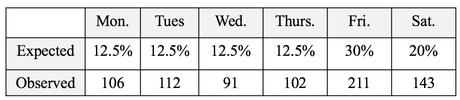 The Test Statistic z can be used to determine whether there is a Statistically Significant difference between the the Proportions of 2 Populations or Processes. It can also give us a Confidence Interval estimate of a Population or Process Proportion. For example, "The Proportion of voters who favor Candidate A is 55% plus or minus 2%."
1 Comment
Hey, great job on this blog post about test statistics! I really appreciated the clear and concise explanation of the different types of test statistics commonly used in statistical testing, including z, t, F, and Chi-Square. Your breakdown of when each statistic is appropriate and the strengths and weaknesses of each was super helpful. I also liked how you provided examples of each test's application to real-world scenarios. Keep up the good work! Leave a Reply. |
AuthorAndrew A. (Andy) Jawlik is the author of the book, Statistics from A to Z -- Confusing Concepts Clarified, published by Wiley. Archives
March 2021
Categories |

 RSS Feed