|
In determining which Distribution to use in analyzing Discrete (Count) data, we need to know whether we are interested in Occurrences or Units.
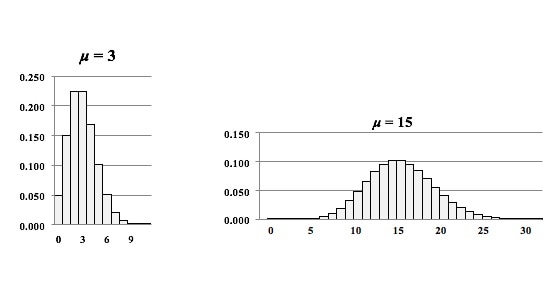
Let's say we are inspecting shirts at the end of the manufacturing line. We may be interested in the number of defective Units – shirts, because any defective shirt is likely to be rejected by our customer. However, one defective shirt can contain more than one defect. So, we are also interested in the Count of individual defects – the Occurrences – because that tells us how much of a quality problem we have in our manufacturing process. For example, if 1 shirt has 3 defects, that would be 3 Occurrences of a defect, but only 1 Unit counted as defective. We would use the Poisson Distribution in analyzing Probabilities of Occurrences of defects. To analyze the Probability of Units, we could use the Binomial or the Hypergeometric Distribution. Below are two graphs of the Poisson Distribution -- one for the Distribution with the Mean of 3 and the other with a Mean of 15. You can see how the Distribution spreads out (the Variance gets larger) as the Mean gets larger. In fact, the Mean of a Poisson Distribution is equal to its Variance.
0 Comments
Leave a Reply. |
AuthorAndrew A. (Andy) Jawlik is the author of the book, Statistics from A to Z -- Confusing Concepts Clarified, published by Wiley. Archives
March 2021
Categories |


 RSS Feed