|
The concept of Null Hypotheses can be confusing, because it is about nothingness. And the human mind is wired to understand things that exist, not things that don't exist. I've found that it helps to state the Null Hypothesis as either
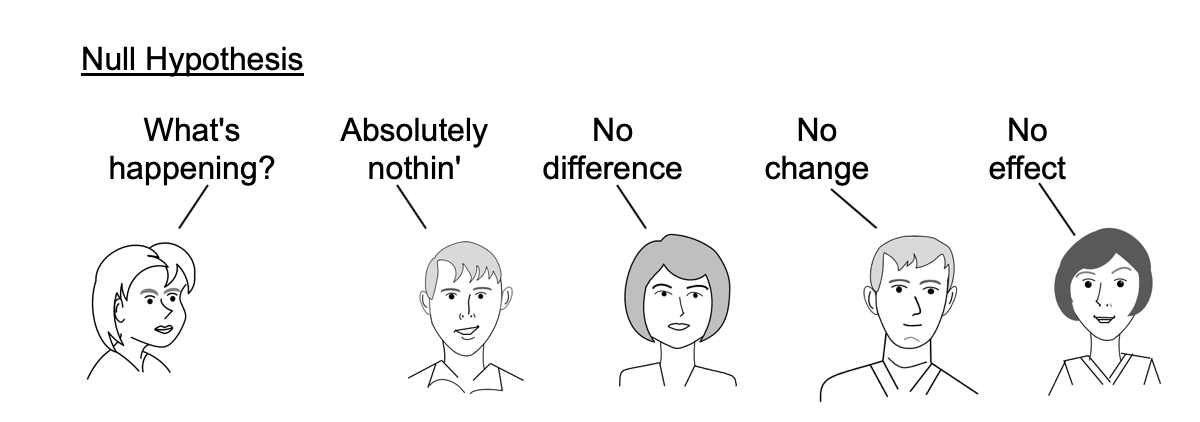 So, if we are comparing the Means of Populations A and B, we could say: Null Hypothesis (H0) "There is no difference between the Mean of Population A and the Mean of Population B." But, it can be stated even more clearly and succinctly as an equation: 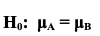 And the Alternative Hypothesis would be the opposite of this: 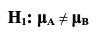 This is for a 2-tailed test: 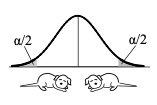 It gets more complicated when we get into 1-tailed tests. In those tests, we'd have either  But that would be the subject of another Statistics Tip.
0 Comments
I just uploaded a new video to the the book's channel on YouTube. It's the 3rd of 3 in a playlist on Samples and Sampling. It's called Sample Size Part 2 (of 2) – for Measurements/Continuous Data. https://youtu.be/mxR-Lsc3ikc 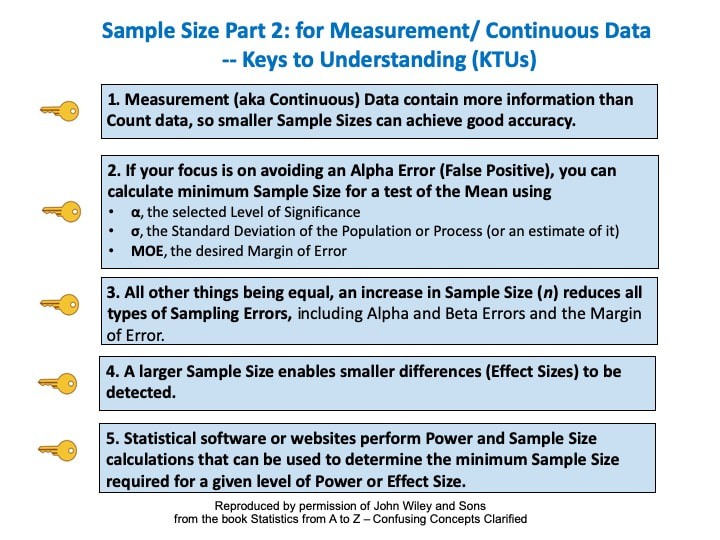 For a complete list of videos based on this book that are completed and next in line, please see the videos page of this website.
I just uploaded a new video, Sample Size Part 1 – Proportions of Count Data This was uploaded to my YouTube channel Statistics From A to Z, Confusing Concepts Clarified. It will be part of a playlist on Samples and Sampling. 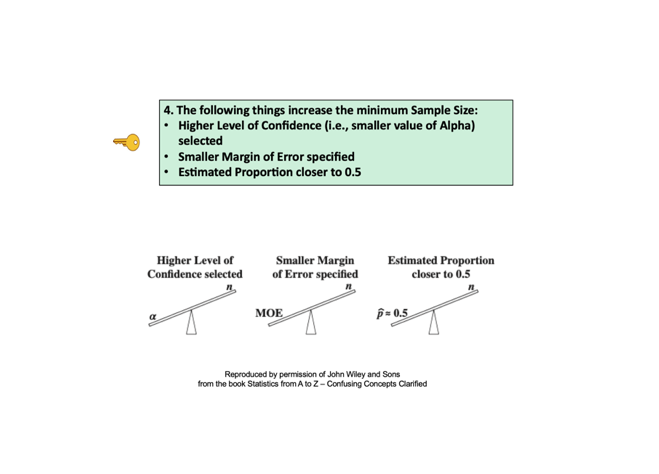 See the Videos page of this website for the latest status of my statistics videos completed and planned
Confusing language and terminology is a big part of what makes statistics confusing. Each Binomial Trial -- also known as a Bernoulli Trial -- is a random experiment with only 2 possible outcomes, called "success" and "failure". The Probability of success is the same every time the experiment is conducted. A coin flip illustrates this perfectly. You either get "heads" or "tails", and the Probability of each coin flip (Binomial Trial) is always 50% heads (or 50% tails).  In a Binomial Trial, each trial is counted as either a success or failure. And a success is defined as what we want to count. Let's say we are performing quality control in a manufacturing process. We are counting defects. Every time we find a defect, we add 1 to the count of "successes".
I always found that confusing, so in the book, instead of saying "success" or "failure", I suggest saying "yes" or "no". I just uploaded a new video, "Samples, Sampling", to my YouTube channel. Here's the link to the video: https://youtu.be/bvglAgAZtXE. It is the first in a playlist on Samples. The other two videos will be about how to determine the Sample Size for Proportions and Count Date, and Sample Size for Measurement/ Continuous Data. Here are the 6 Keys to Understanding the concept. This 17 minute video explains them in detail. 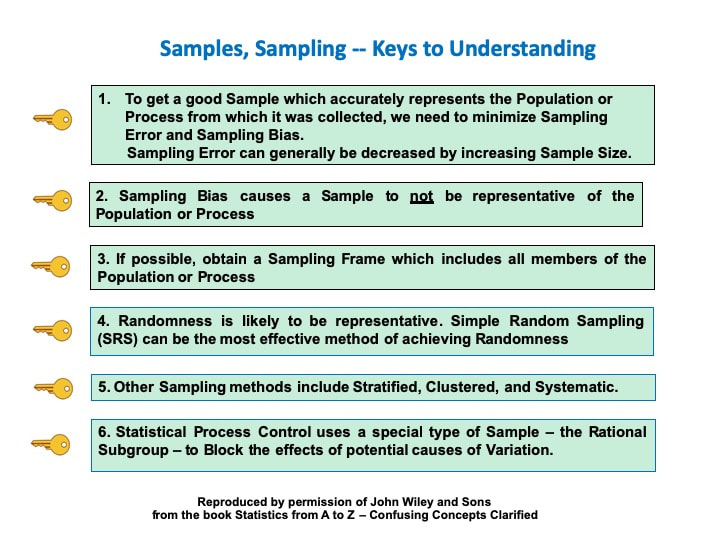 Statistics Tip: In 2-Factor (2-Way) ANOVA, separated lines show that Factor A has an effect10/24/2019 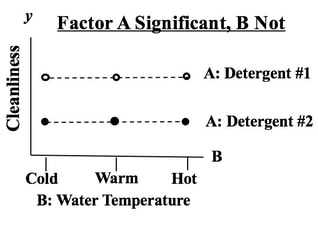 In this example, we are testing 2 Factors for their effect on the y Variable, Cleanliness.
We see from the graph that -- for all three levels of Factor B, Detergent #1 cleans better than Detergent #2. The lines are substantially separated, indicating that the difference is Statistically Significant. (The ANOVA numbers will tell us for sure.) If Factor B did have an effect, the lines would be slanted. Again, separated lines tell us that Factor A has an effect. 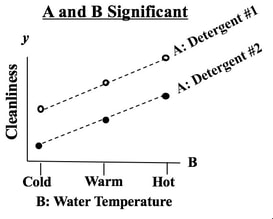 If the lines were not separated, as below, then Factor A does not have an effect. 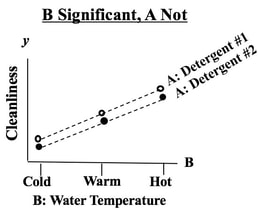 The purpose of Regression analysis is to develop a cause and effect "Model" in the form of an equation. To keep things simple, let's talk about Simple Linear Regression, in which the equation is y = bx + a The Regression analysis comes up with the values for b and a. 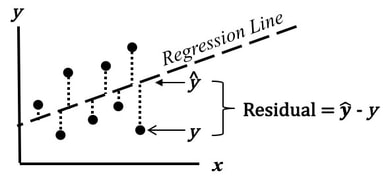 Residuals represent the Error in the Regression Model. They represent the Variation in the y variable which is not explainedby the Regression Model. So, Residuals must be Random. If not -- if Residuals form a pattern -- that is evidence that one or more additional factors (x's) influence y. A Scatterplot of Residuals against y-values should illustrate Randomness: 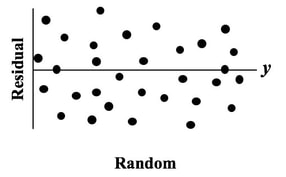 Being Random means that the Residuals
Here are some patterns which indicate the Regression Model is incomplete. 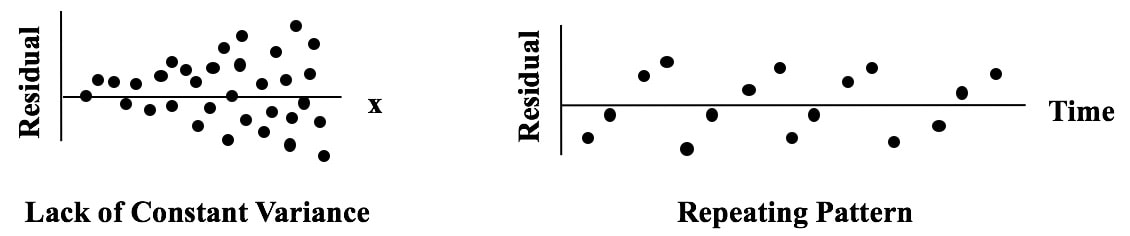 This is the final video in a 6-video playlist on Statistical Tests. youtu.be/MpQAxe6vM00  A key to understanding, compare and contrast tables and a 6-step process, help you gain a clear understanding of this concept. https://youtu.be/MnnOK0I2PLE  One of the things which make statistics confusing is the confusing language. There is the triple negative of "Fail to Reject the Null Hypothesis". There are several instances where a single concept has multiple names. This tip is about what one might call an "asymmetry" in concept names.
So, what is Alpha? First of all, the person performing the a statistical test selects the value of Alpha. Alpha is (called the "Significance Level"). It is 1 minus the Confidence Level. 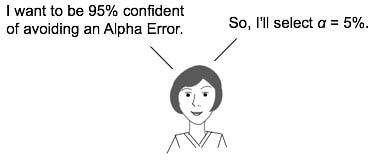 Alpha is the maximum value for p(the probability of an Alpha Error) which the tester is willing to tolerate and still call the test results "Statistically Significant". 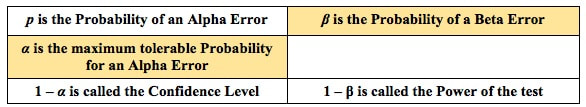 For more on Alpha and p, you can view 2 videos on my YouTube channel http://bit.ly/2dD5H5f
|
AuthorAndrew A. (Andy) Jawlik is the author of the book, Statistics from A to Z -- Confusing Concepts Clarified, published by Wiley. Archives
March 2021
Categories |

 RSS Feed